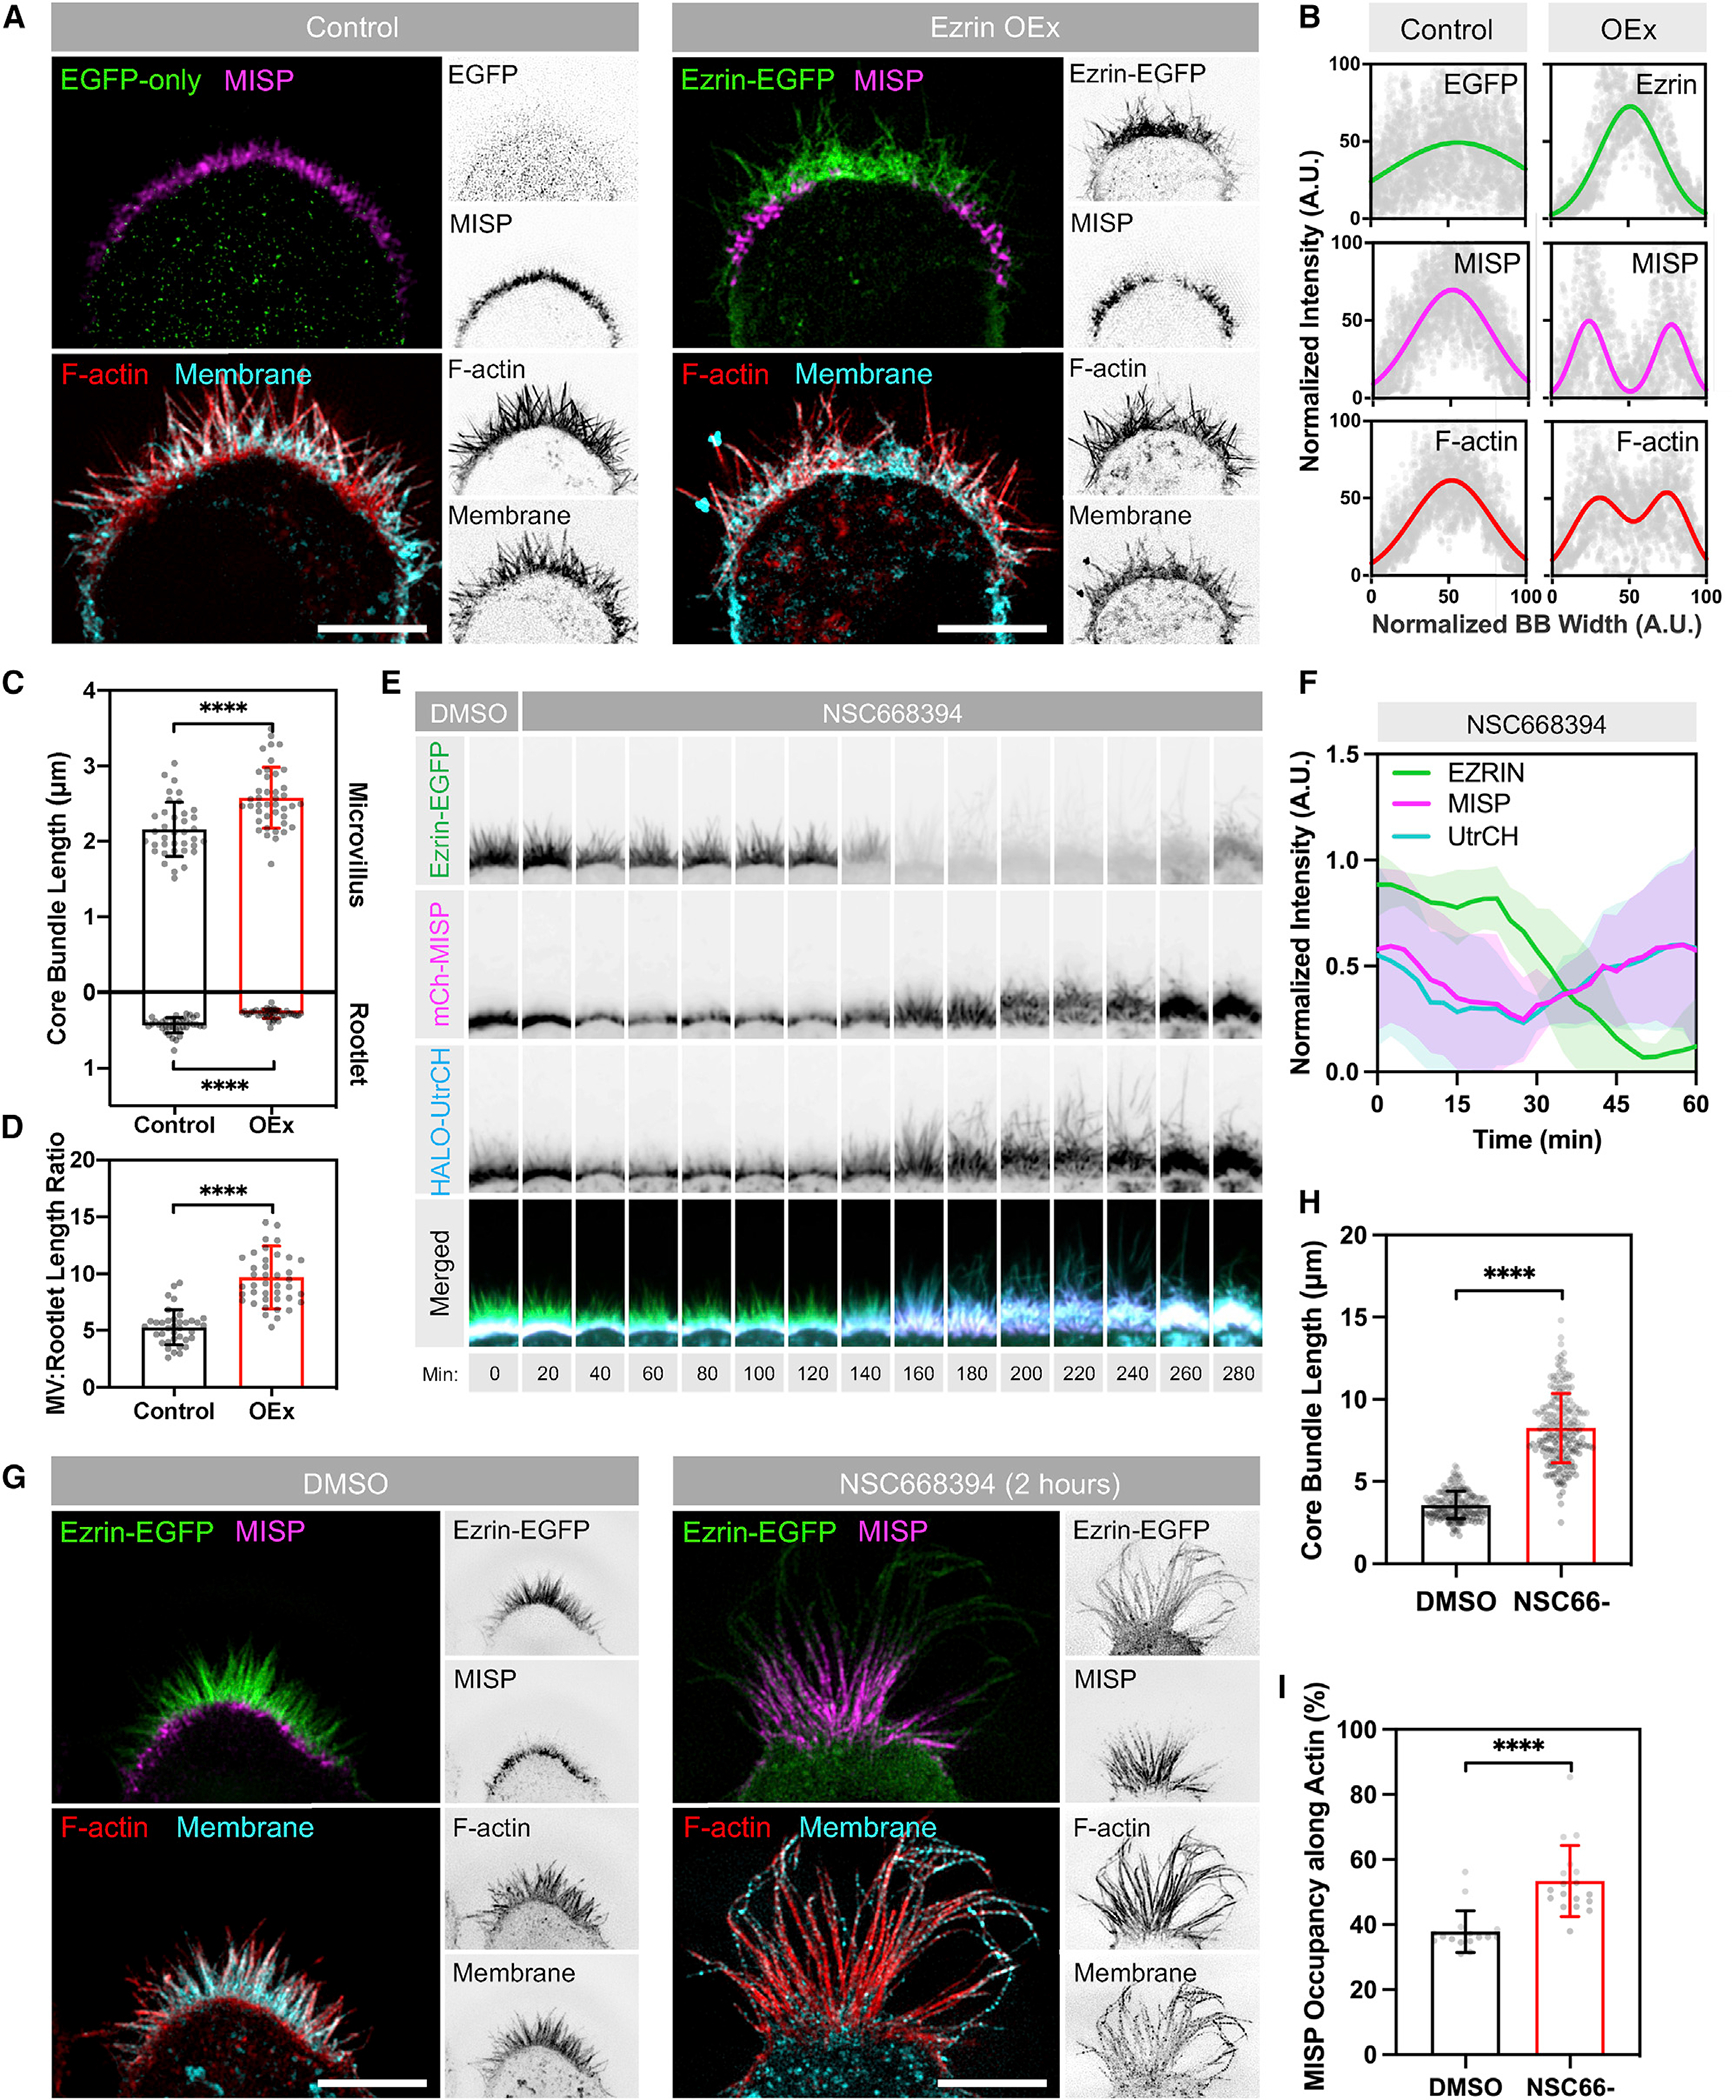
Figure 6. MISP and ezrin exhibit mutually exclusive targeting at opposite ends of core actin bundles.

(A) SIM Max IPs of W4 cells overexpressing EGFP alone (green, left panel) or ezrin-EGFP (green, right panel) and stained for endogenous MISP (magenta), F-actin with phalloidin (red), and membrane with WGA (cyan). Each panel shows two-color merges with their inverted single channels. Scale bar: 5 μm.
(B) Intensity distributions across the BB from left to right, measured for each marker described in (A). Distributions were fit using single- or double-Gaussian curves. Number of cells per condition was ≥8.
(C) Lengths of microvilli (top plot) and rootlets (bottom plot) from W4 cells shown in (A). Each dot represents the average of >10 length values per cell; n ≥ 37. All data represent three independent experiments.
(D) Microvillus/rootlet length ratios measured on a per-cell basis from (C).
(E) Confocal Max IP time-series montages of a W4 cell expressing ezrin-EGFP (green), mCherry-MISP (magenta), and HALO-UtrCH (blue) before and after adding NSC668394 (ezrin inhibitor). The width of each box in the montage is 7 μm.
(F) Fluorescence intensity values of markers described in (E). Data are shown as mean ± SD.
(G) SIM Max IPs of W4 cells expressing ezrin-EGFP in DMSO (left panel) or NSC668394 (right panel) conditions after 2 h of exposure. Cells were stained for endogenous MISP (magenta), F-actin with phalloidin (red), and membrane with WGA (cyan). Each panel shows two-color merges with their inverted single channels. Scale bar: 5 μm.
(H) Lengths of core bundles from conditions described in (G). Each dot represents the length of a single core bundle; n > 190 length values.
(I) Percentages of MISP occupancy along core bundles from the conditions in (G). Each dot represents the percentage of the average MISP coverage along core bundles per cell; n > 16 cells per condition; length values per cell >10.
All bar plots and error bars denote mean ± SD. p values were calculated using the unpaired t test (****p < 0.0001).
