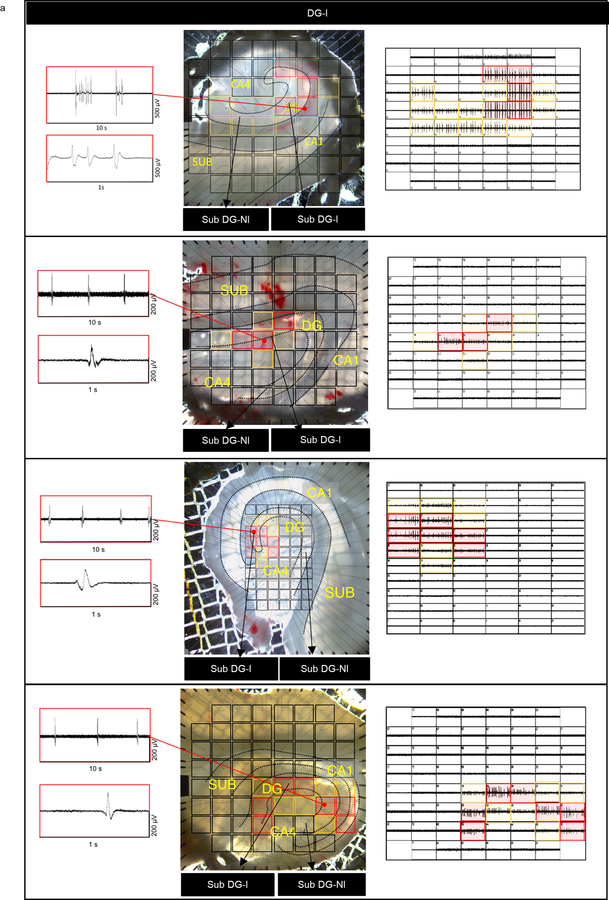
Extended Data Fig. 5. Mapping inter-ictal like activity with multi-electrode array (MEA) in DG-I cases.
(a) Illustrative 8×8 and 6×10 60-electrode MEA configuration and hippocampal slice recording of adult human MTLE tissue (4 representative cases from DG-I group). Inter-ictal like activity detected by electrodes covering the dentate gyrus (DG). Red markings overlaying the brightfield slice image and individual electrode recordings corresponds to inter-ictal like activity with comparatively higher amplitude, yellow markings – electrodes detecting comparatively lower amplitude and black markings – electrodes not detecting inter-ictal like activity.

