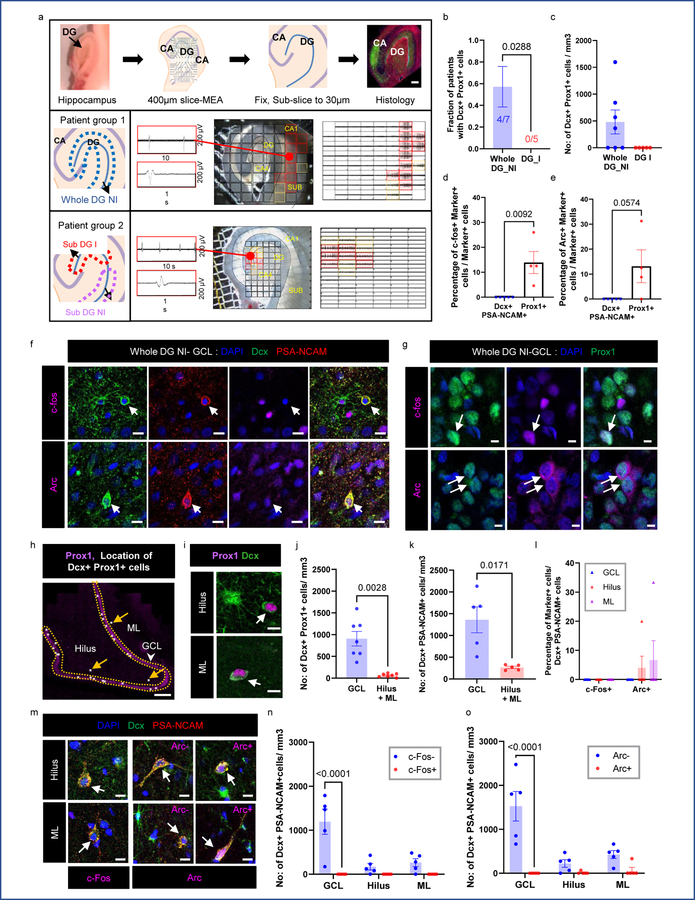
Figure 4: Newborn neuron behavior with epileptiform activity.
(a) Experimental workflow. MTLE cases cluster as whole DG non-inter-ictal-like activity (Patient Group 1: Whole DG-NI) and DG inter-ictal-like activity (Patient Group 2: DG-I). Lower panels: Multi-electrode array (MEA) recording of adult human hippocampus. Red markings indicate higher amplitude inter-ictal-like activity, yellow markings – lower amplitude and black markings – no activity. Scale bar: 500μm. (b) Fraction of patients containing neurogenesis in Whole DG-NI (N = 7) and DG-I (N = 5). Unpaired two tailed t-test. (c) Number of Dcx+ Prox1+ cells/mm3 in Whole DG-NI (N = 7) and DG-I (N = 5). (d, e) Percentage of mature Prox1+ neurons (N = 4) and immature Dcx+ PSA-NCAM+ neurons (N = 5) that co-express c-fos (d) and Arc (e). Unpaired two tailed t-test. (f) Dcx+ (green) PSA-NCAM+ (red) immature neurons stained for IEGs c-fos and Arc (purple; N = 5). Scale bar: 10μm. (g) Prox1+ (green) mature granule neurons stained for c-fos and Arc (purple; N = 4). Scale bar: 10μm. (h) Location of Dcx+ Prox1+ immature neurons as white dots in the GCL, Hilus and ML. Arrows mark cells outside the GCL. Scale bar 500μm. (i) Dcx+ Prox1+ cells in hilus and ML. Scale bar: 10μm. (j) Number of Dcx+ Prox1+ cells/mm3 in the GCL, hilus and ML (N = 7) Paired two tailed t-test. (k) Number of Dcx+ PSA-NCAM+ cells/mm3 (N = 5) Paired two tailed t-test. (l) Percentage of Dcx+ PSA-NCAM+ cells that are c-fos+ and Arc+ in the Whole DG-NI group (N = 5). (m) Dcx+ (green) PSA-NCAM+ (red) immature neurons in the hilus and ML stained for c-fos (purple). Dcx+ (green) PSA-NCAM+ (red) immature neurons stained for Arc (purple) in the hilus and ML (N = 5). Scale bar: 10μm. (n, o) Number of Dcx+ PSA-NCAM+ cells/mm3 that are c-fos −/+ (n) and Arc −/+ (o) in the Whole DG-NI group (N = 5). Two-way ANOVA ((n) F 2,24 = 10.02, p=0.0007, (o) F 2,24 = 11.65, p=0.0003) Sidak’s multiple comparison’s test. Error bars represent s.e.m across individual cases.

