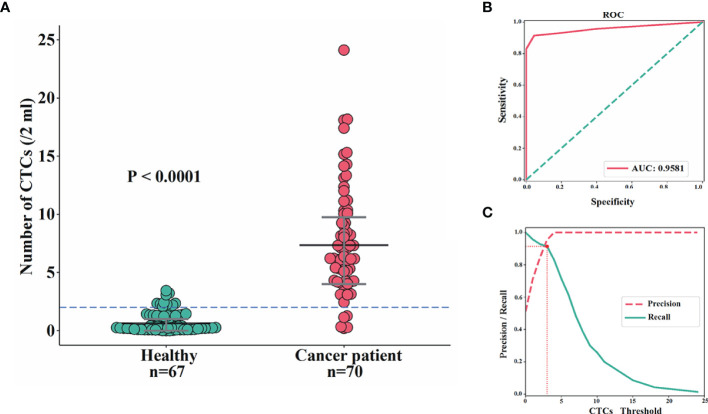
Figure 2.
Comparisons of CTC enumeration between BC patients and female controls. (A, B) The difference of CTC numbers within 2 ml of blood between BC patients and female controls was extremely significant (P<0.0001) (A) with AUC being 95.81% (B). (C) The optimal threshold based on precision-recall curve suggested that ≤2 CTCs within 2 ml of blood predict healthy females, whereas more than 2 CTCs predict patients.

