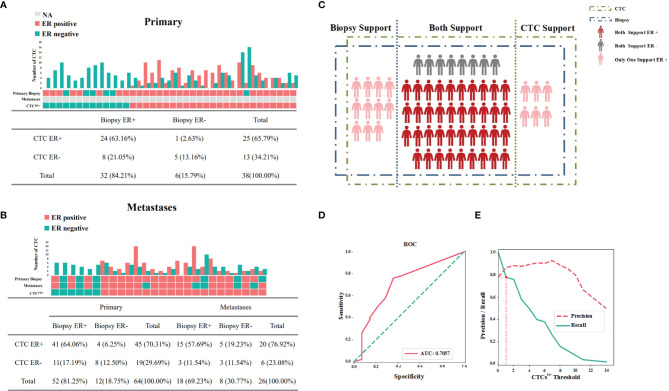
Figure 3.
Expression profiles for ER of available IHC results and CTCs. (A) Concordance/discordance in the expression of ER between CTCs and corresponding primary tumors. (B) Concordance/discordance in the expression of ER between CTCs and corresponding metastatic IHC results. (C) Distribution of ER in CTCs and corresponding IHC results of the patients with available samples. (D) The area under the curve under the assumption that the accuracy of ER detection by IHC was 100%. (E) The optimal threshold on the basis of precision-recall curve suggested that at least one ER-positive CTC within 2 ml of blood be defined as CTCER+.

