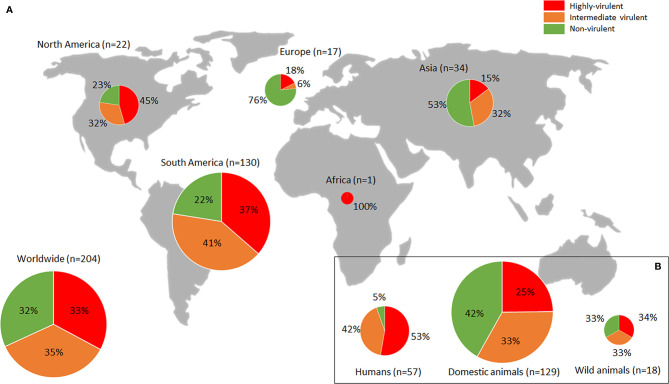
Figure 1.
Worldwide Toxoplasma gondii phenotypic diversity distribution. (A) Proportion of highly-, intermediate- and non-virulent isolates (based on mortality rates in mice) found in each continent. (B) Figures observed pertaining to infected hosts (humans, domestic or wild animals). Sizes of pie charts correlate with total number of isolates (n). Only studies in which mortality in outbred mice was assessed, implementing at least 3 doses of IP or SC inoculated tachyzoites (serial 10-fold dilutions from 1 to 106 parasites/mouse), and 28-dpi animal monitoring (Saraf et al., 2017) were considered. Data used are compiled in Supplementary Table S1 .

