Figure 1.

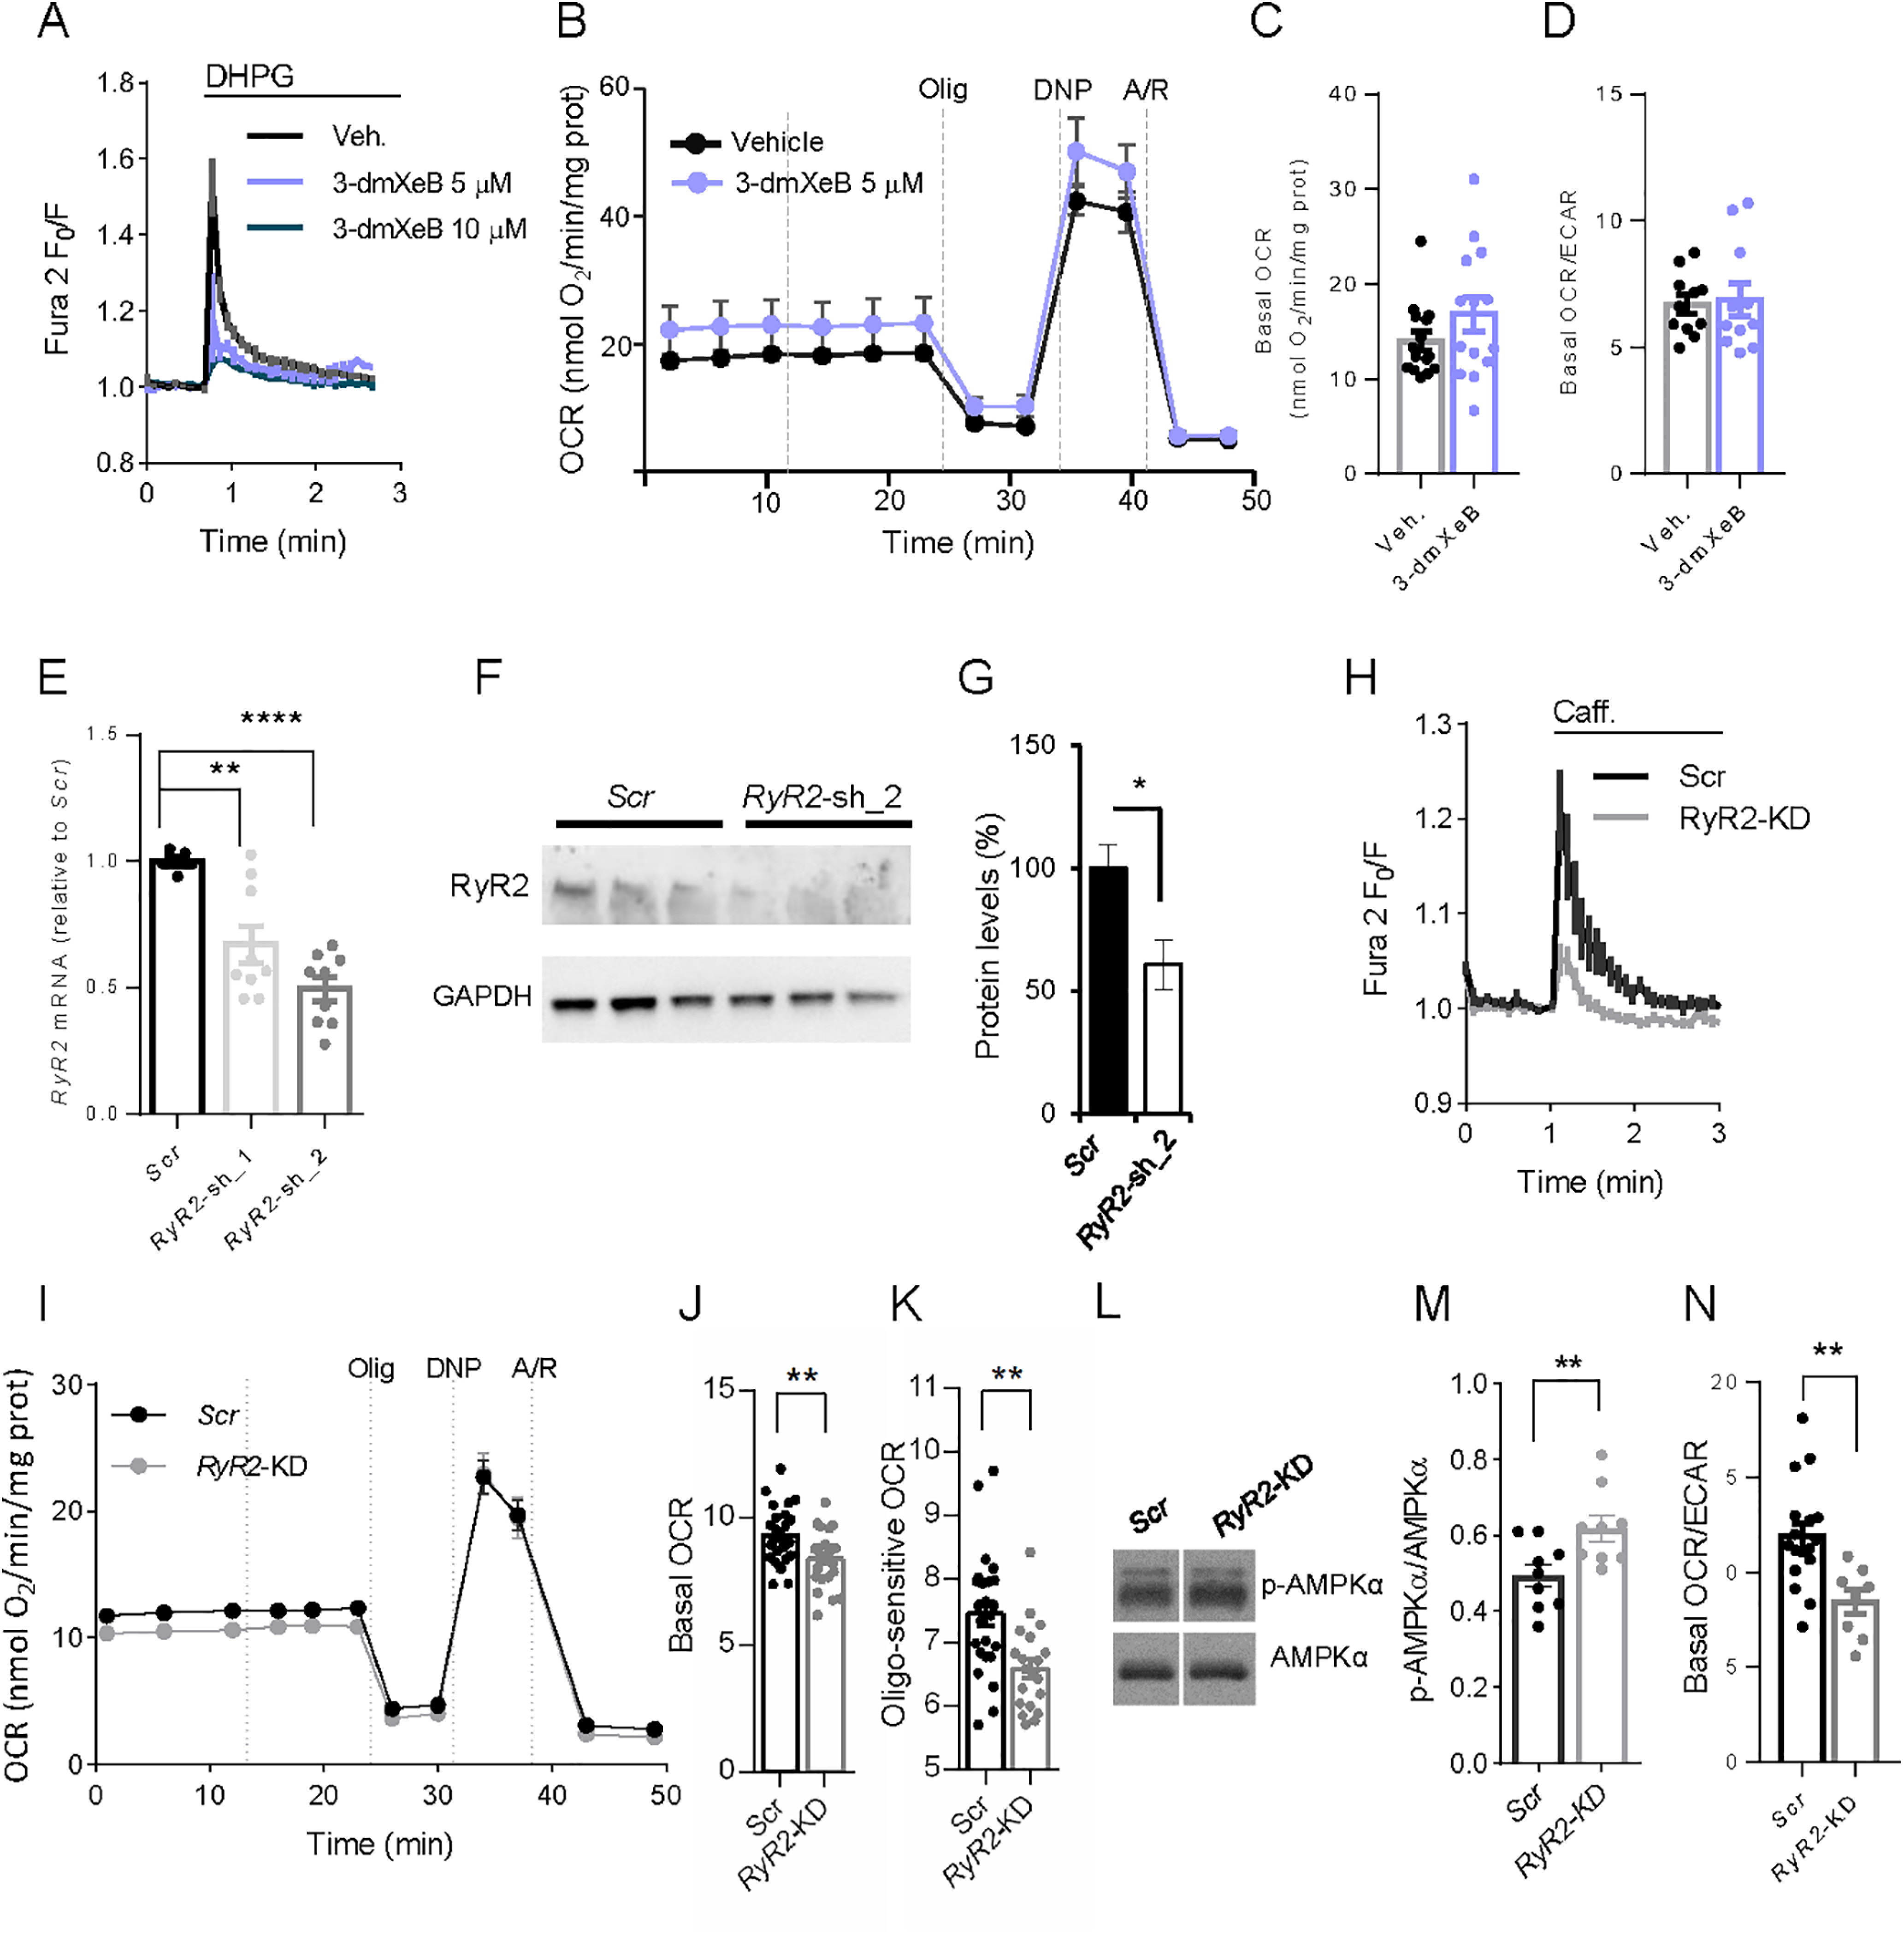
RyRs control neuronal mitochondrial respiration. A, 5 and 10 μm 3-dmXeB substantially reduces the Ca2+ transients induced by 200 μm DHPG, an agonist of Group I metabotropic glutamate receptors in cortical neurons. Neuronal cultures were preincubated with 3-dmXeB 60 min before the experiment was started. B, C, Incubation with 5 μm 3-dmXeB does not change basal respiration in cortical neurons. 3-dmXeB was added to the culture 60 min before the experiment was started. Mitochondrial function was determined through sequential addition of 6 μm oligomycin (Olig), 0.5 mm DNP, and 1 μm/1 μm antimycin A/rotenone (A/R) at the indicated time points. Data are mean ± SEM; n = 7. C, Basal respiration corrected for nonmitochondrial respiration. Dots represent individual data. Error bars indicate mean ± SEM; n = 14 or 15. D, Basal OCR/ECAR ratio values. Data are mean ± SEM; n = 8-17. E, qPCR analysis of the cDNA obtained from neuronal cultures transduced with rAAV containing two different RyR2-directed (RyR2-KD1 or RyR2-KD) or Scrambled (Scr) shRNA using specific oligos; values were normalized to RyR2 mRNA in Scr neurons. Data are mean ± SEM, 5-9 wells (dots) from two independent experiments. One-way ANOVA: **p ≤ 0.01, ****p ≤ 0.0001, post hoc Bonferroni test. F, Western blot analysis of RyR levels in neurons transduced with rAAV containing RyR2-directed (RyR2-KD) or Scrambled shRNA (Scr). GAPDH was used as loading control. G, Quantitative analysis from Western blot of RyR2/GAPDH. Data are mean ± SEM; n = 3. *p = 0.049 (two-tailed t test). H, RyR2 silencing decreases caffeine-induced [Ca2+]i signal, which is blocked by ryanodine or dantrolene (see Extended Data Fig. 1-1A,B). I–K, RyR2 silencing decreases basal and oligomycin-sensitive OCR levels in neurons. I, Data are mean ± SEM; n = 7 or 8. J, Data are mean ± SEM; n = 14-16. **p = 0.0037. K, Data are mean ± SEM; n = 20-24. **p = 0.0017 (t test). L, Representative Western blot analysis of p-AMPK and AMPK levels. M, Quantitative analysis from Western blot of p-AMPK/AMPK levels. Dots represent individual data. Error bars indicate mean ± SEM; n = 9. **p = 0.0069 (t test). N, RyR2 silencing decreases basal OCR/ECAR ratio values. Data are mean ± SEM; n = 8-17, from 3 independent experiments and does not change ATP, ADP, or AMP levels (see Extended Data Fig. 1-1C–G). **p = 0.0041 (two-tailed t test).
