Figure 2.

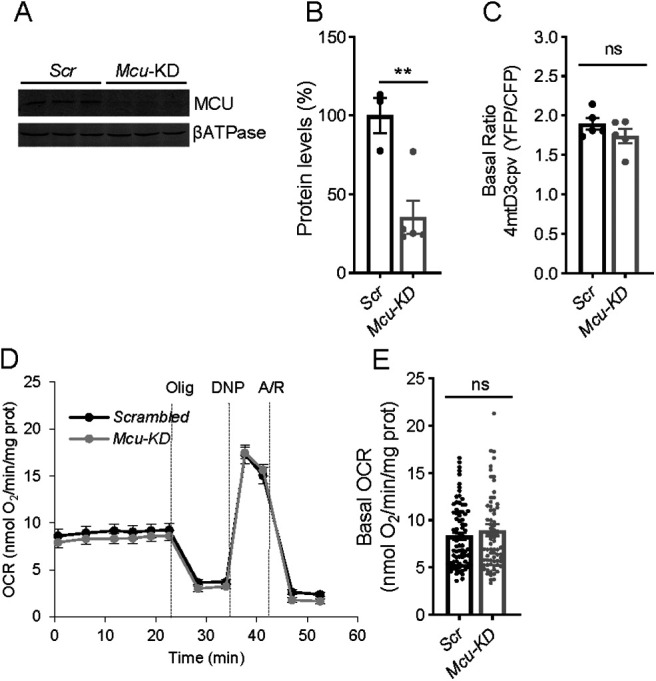
Basal mitochondrial Ca2+ and respiration do not change in Mcu-KD cortical neurons. A, Representative Western blot analysis of MCU levels in neurons transduced with rAAV-containing MCU-directed (Mcu-KD) or Scrambled shRNA (Scr). βATPase was used as loading control. B, Quantitative analysis from Western blot of MCU/ βATPase. Dots represent individual data. Error bars indicate mean ± SEM; n = 3-5. **p = 0.0072 (t test). C, Basal ratio of 4mtD3cpv probe reflecting basal mitochondrial Ca2+ levels in Scr and Mcu-KD neurons. Dots represent individual data. Error bars indicate mean ± SEM; n = 19-21 neurons per condition from 5 independent platings. p = 0.2335 (t test). D, E, Basal respiration in Scrambled and Mcu-KD neurons expressed as OCR (nmol O2/min/mg protein). Dots represent individual data. Error bars indicate mean ± SEM; n = 26 per condition from 5 independent platings. p = 0.4193 (t test).
