Figure 4.

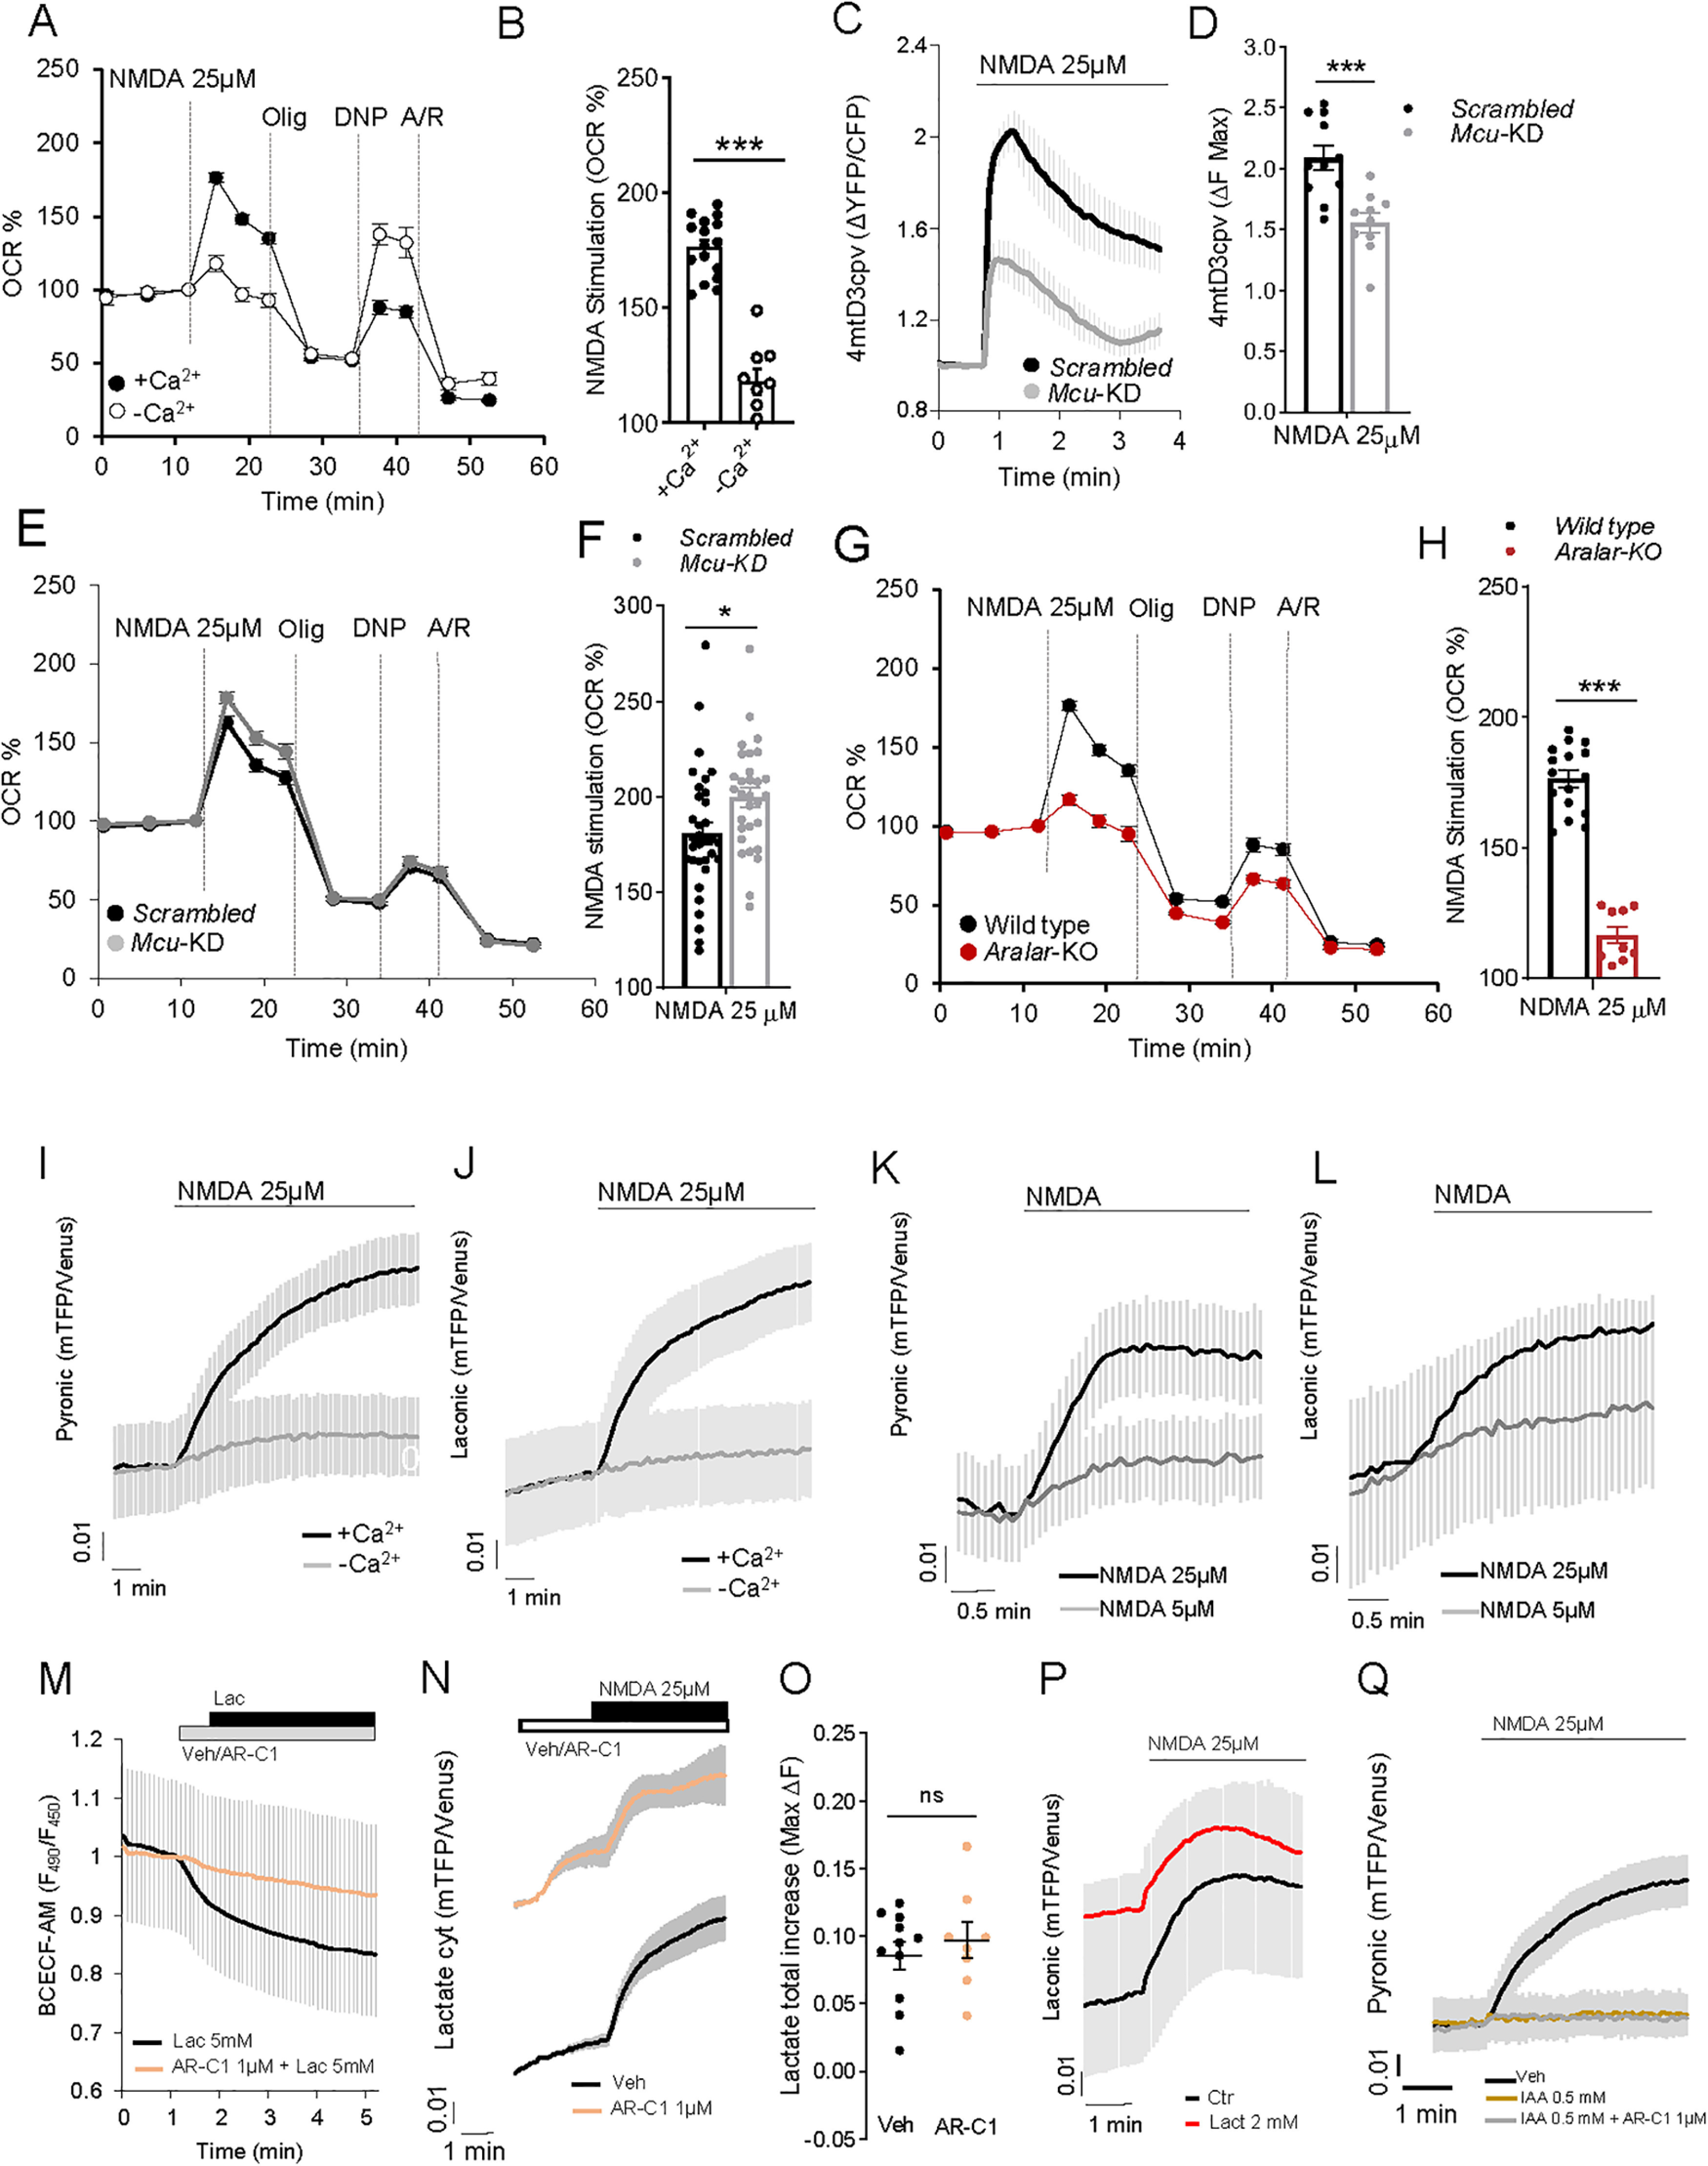
NMDA stimulation of OCR and cytosolic pyruvate and lactate formation. A, 25 μm NMDA-stimulated respiration in cortical neurons incubated in the presence of 2 mm Ca2+ (+Ca2+) or without calcium (–Ca2+; plus 100 μm EGTA), expressed as percentage of basal values (OCR %). B, NMDA-stimulated OCR (%). Data are mean ± SEM (bars); n = 9-16 (dots) from two different experiments. One-way ANOVA: ***p ≤ 0.001, post hoc Bonferroni test. C, 25 and 5 μm (Extended Data Fig. 4-1A,B) NMDA-induced changes in mitochondrial Ca2+ (Ca2+-mit) in Scrambled (Scr) and Mcu-silenced (Mcu-KD) neurons transfected with 4mtD3cpv probe. D, Quantification of maximum Ca2+-mit increment (ΔF max) after NMDA stimulation. Data are mean ± SEM (bars); n = 10 or 11 from 3 independent experiments. ***p = 0.0006 (t test). NMDA-induced cytosolic Ca2+ signals were the same in Scrambled and MCU-KD neurons (Extended Data Fig. 4-2A–D). E, 25 and 5 μm (Extended Data Fig. 4-1C,D) NMDA-stimulated respiration in Scrambled and Mcu-KD neurons, expressed as percentage of basal values (OCR %). F, Quantification of NMDA-stimulated OCR (%). Data are mean ± SEM (bars); n = 30-33, 5 independent experiments. *p = 0.0173 (t test). G, 25 and 5 μm (Extended Data Fig. 4-1E,F) NMDA-stimulated respiration in WT and Aralar-KO neurons, expressed as percentage of basal values (OCR %). H, Quantification of NMDA-stimulated OCR (%). Data are mean ± SEM (bars); n = 9-16 (dots) from 2 independent experiments. ****p < 0.0001 (t test). Cytosolic and mitochondrial Ca2+ signals were the same in WT and Aralar-KO neurons (Extended Data Fig. 4-2E–L). I, J, Effect of NMDA in the presence (+Ca2+) or absence (–Ca2+) of calcium on cytosolic pyruvate (Pyr) and lactate (Lac) in neurons transfected with pyronic (I) and laconic (J) probes. K, L, Dose-dependent effect of 5 and 25 μm NMDA induction of Pyr (K) and Lac (L) production. Data are mean ± SEM; n = 5-15 neurons per condition from 2-6 independent experiments. M, Intracellular pH variation determined in BCECF-AM-loaded neurons after 5 mm lactate (Lac) acute addition with or without 1 min pre-incubation with 1 μm MCT1/2 inhibitor AR-C155858 (AR-C1). Data are mean ± SEM; n = 6 per condition from 2 independent experiments. N, Lactate changes induced by 25 μm NMDA in neurons to which 1 μm AR-C1 or medium (Veh) was pre-added. O, Quantification of maximum fluorescence change (ΔF max) in Lac after Veh/1 μm AR-C1 and 25 μm NMDA. P, Lactate changes induced by 25 μm NMDA in neurons in the presence (Lact) or absence (Ctr) of extracellular 2 mm lactate. Q, Pyruvate changes induced by 25 μm NMDA in neurons pre-incubated 30 min with HCSS (Veh), 0.5 mm IAA, or IAA + 1 μm AR-C1 (IAA + AR-C1). Data are mean ± SEM; n = 8-20 per condition from 4-8 independent experiments. The 4mtD3cpv, pyronic, laconic, and BCECF-AM experiments were performed in HCSS, 2.5 mm glucose, and 2 mm Ca2+ or 100 μm EGTA (–Ca2+).
