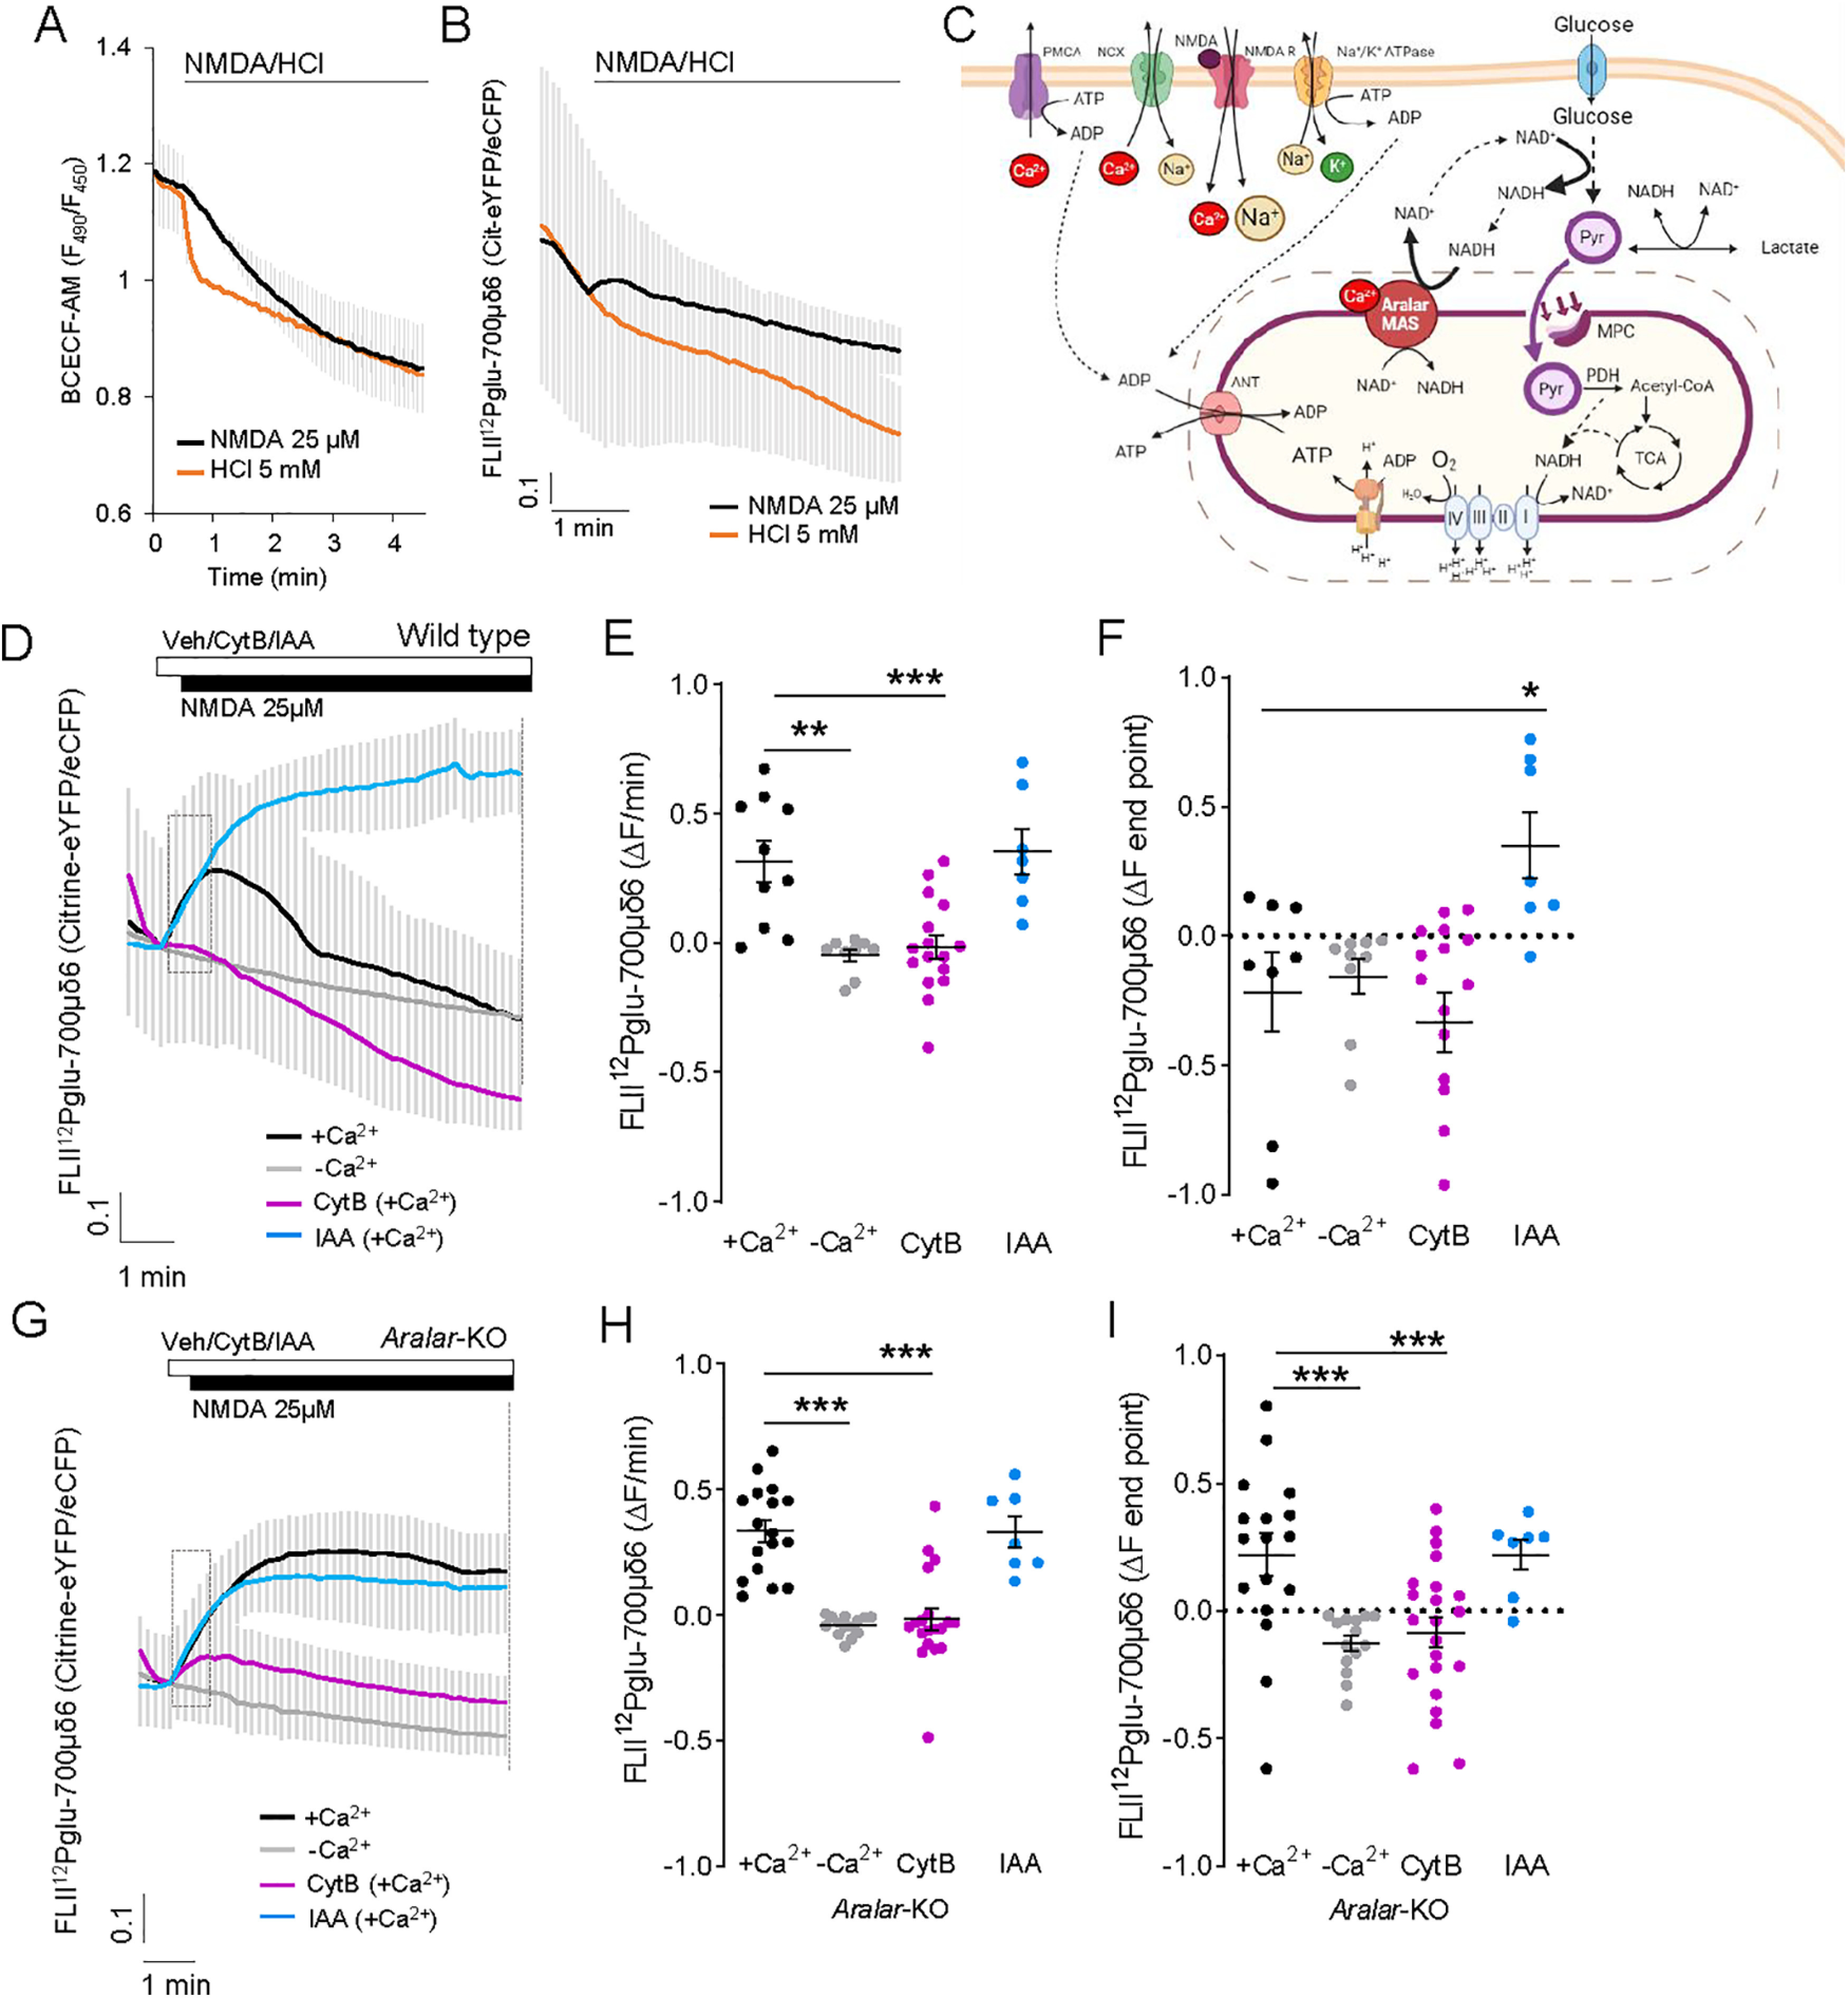
Figure 6.

25 μm NMDA-induced changes in cytosolic glucose levels. A, B, Changes in cytosolic pH (A) or intracellular glucose (B) in BCECF-loaded or FLII12Pglu-700μδ6 transfected neurons after the acute addition of 25 μm NMDA or 5 mm HCl. Data are mean ± SEM; recordings from 5 or 6 cells per condition. C, Representative scheme Ca2+-regulated Aralar-MAS activation upregulates glycolysis and pyruvate production, which fuels mitochondrial respiration, through regulation of cytosolic NAD+/NADH ratio. Image created with www.BioRender.com. D, F, 25 μm NMDA induced changes in glucose levels in WT (D) and Aralar-KO (G) neurons, with or without calcium or with a 20 s pre-incubation with 50 μm CytB or 0.5 mm IAA. E, H, Velocity of increase of glucose levels during the first 30 s after stimulation (ΔF/min) in WT (E) and Aralar-KO (H) neurons. F, I, FRET ratio change between pre-addition of NMDA and the end of the recording (ΔF endpoint) in WT (F) and Aralar-KO (I) neurons. Data are mean ± SEM; recordings from 7 to 17 cells per condition from 3 to 5 independent experiments. One-way ANOVA: *p ≤ 0.05, **p ≤ 0.005, ***p ≤ 0.001, post hoc Bonferroni test. ΔF at the endpoint after NMDA addition is higher in Aralar-KO than in WT neurons. Two-way ANOVA: **p ≤ 0.005, post hoc Bonferroni test. Assays using BCECF and FLII12Pglu-700μδ6 probes were performed in 2.5 mm glucose and 2 mm Ca2+ (+Ca2+) or 100 μm EGTA (–Ca2+) HCSS.
