Figure 1.
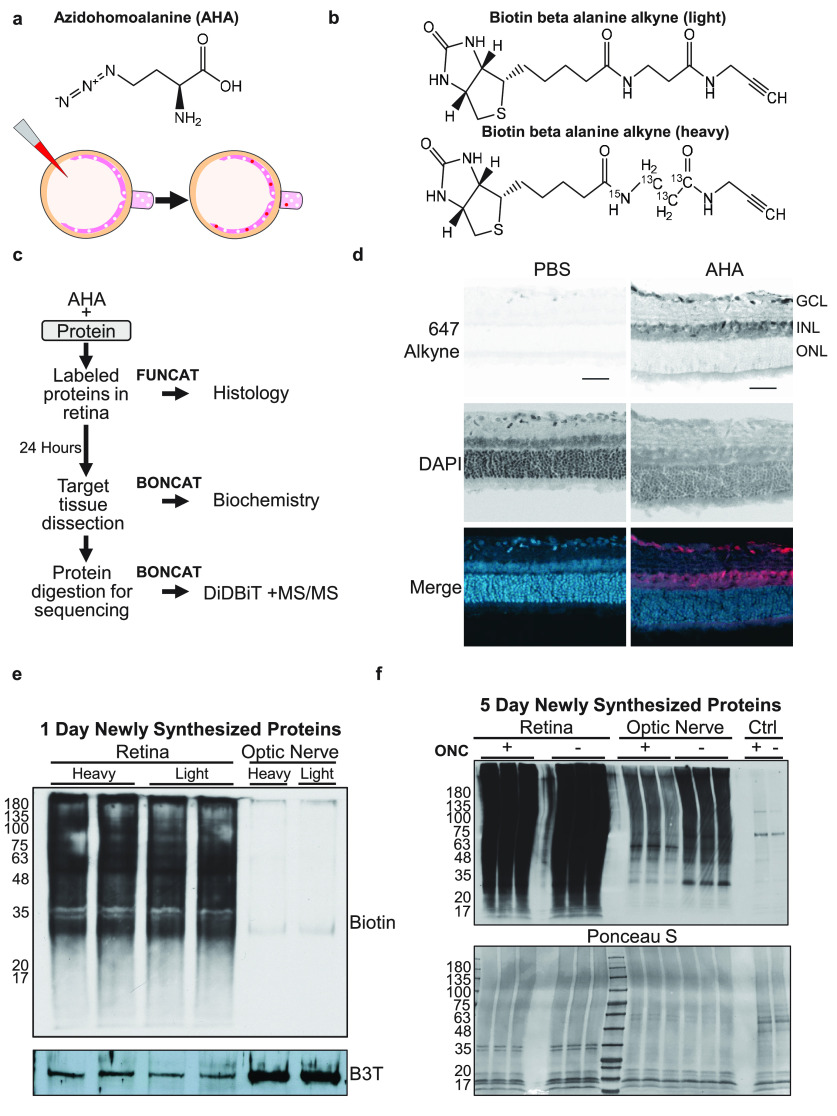
AHA labeling detects newly synthesized proteins in the retina. a, AHA chemical structure (top) and diagram (bottom) of AHA incorporation into newly translating proteins in the retina, and their transport into the optic nerve, after intravitreal AHA injection. White dots represent unlabeled proteins present in retina. After intravitreal AHA injection (red), labeled proteins (red) are synthesized in the retina and transport to the optic nerve. b, Schematic of the two isotopes of biotin beta alanine used for quantitative QBONCAT proteomics. Light (top) and heavy (bottom) biotin beta alanine attached to AHA have a combined molecular mass of 347 and 351, respectively. c, Protocol for visualization of newly synthesized proteins by FUNCAT or biotin tagging by BONCAT for biochemistry and the enrichment and quantification by Direct Detection of Biotin-Containing Tags (Schiapparelli et al., 2014) and tandem mass spectrometry. d, Click reaction to tag AHA-labeled proteins with Alexa 647 alkyne shows distribution of newly synthesized proteins in the retinal ganglion cell layer (GCL) and inner nuclear layer (INL), with no detectable AHA-labeled protein in the outer nuclear layer (ONL). Cell nuclei are labeled with DAPI. Retinas injected with PBS show minimal background labeling. Scale bar, 50 µm. e, Western blot of biotin after click chemistry with either heavy or light biotin-alkyne shows equivalent labeling in retinal tissue with either isotope of biotin, but little to no labeling in optic nerve samples 1 d after AHA labeling. Two replicates of retinal samples are shown. Beta III tubulin (B3T) used as a loading control. Left, Molecular weights. f, Top, Western blot of biotin after click chemistry with AHA-labeled retinas and optic nerves, with (+) and without (−) optic nerve crush injury (ONC) after 5 d of AHA labeling. Samples were run in triplicate. The retinas are extensively labeled and biotin-labeled proteins are detected after transport into the optic nerve. Control (Ctrl) lanes are optic nerve samples after AHA injection without click reaction showing minimal background endogenous biotin signal. Bottom, Ponceau S stain of the samples showing comparable protein loading across samples. Left, Molecular weights.

