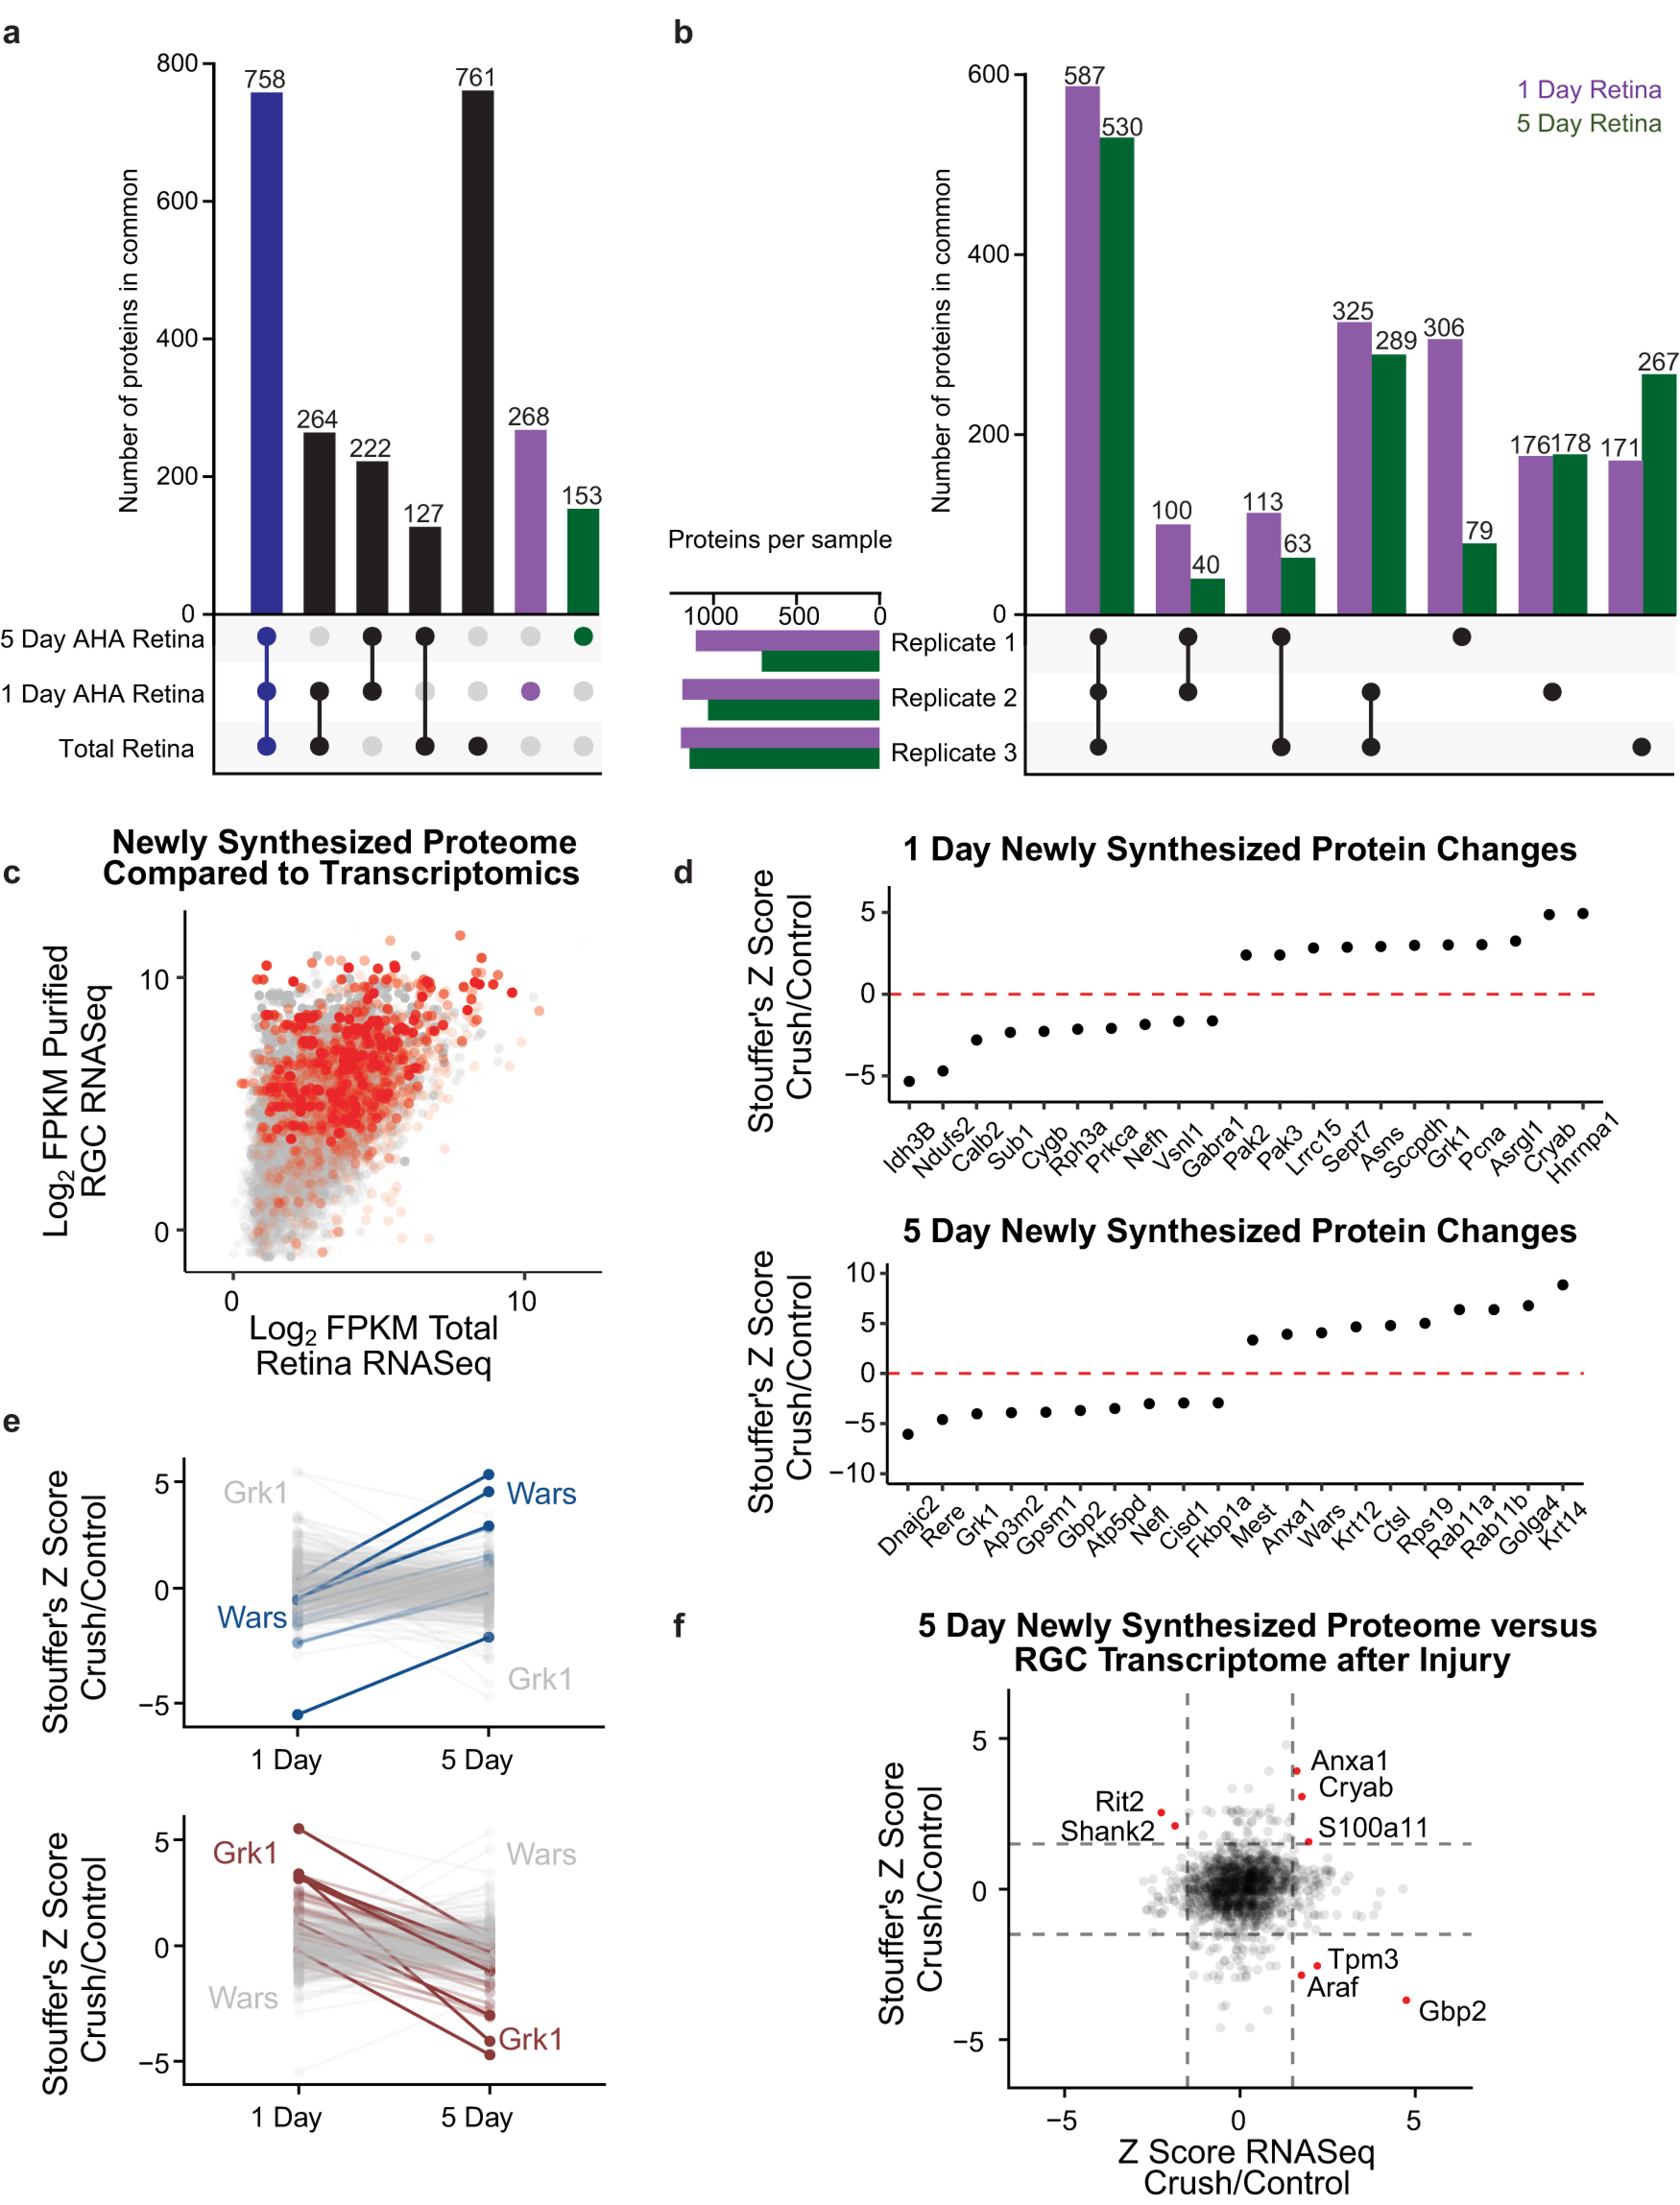
Figure 2.

Comparison of retinal new protein synthesis 1 and 5 d after optic nerve injury. a, Comparison of numbers of proteins identified in one or more of each of the following types of retinal sample: 1 d AHA-labeled new protein synthesis, 5 d AHA-labeled new protein synthesis, and total retinal proteome without injury. Bottom left, Sample types. Filled dots indicate overlap between samples, and bar graphs above show number of proteins in group. Seven hundred fifty-eight proteins were found to be in common between all three sample types (blue bar). Two hundred sixty-eight and 153 proteins were found only in the 1 d and 5 d AHA-labeled samples and not in the total retina sample, respectively (purple and green bars, respectively). Full data are available in Extended Data Figure 2-1. b, Comparisons of numbers of AHA-labeled newly synthesized proteins identified in one or more experimental replicates (Replicate 1, 2, 3) after 1 d (purple) or 5 d (green) of AHA labeling, combining analysis of proteomes detected with and without injury. Full data are available in Extended Data Figure 2-2. c, Total RNA-sequencing data from uninjured retinas (Brooks et al., 2011) were compared with purified RGC transcriptomics (Williams et al., 2017) to develop an understanding of transcript enrichment in RGCs. The mRNAs that have corresponding newly synthesized proteins, detected by our proteome study with 5 d AHA labeling, are highlighted in red. This analysis indicates that the newly synthesized proteome captures more of an RGC-related phenotype than non-RGC phenotype. d, Proteins with the largest differences in AHA-biotin labeling 1 d or 5 d after optic nerve injury, quantified by Stouffer's Z-score across three replicates. e, Comparison of AHA-biotin labeling differences from 1 d to 5 d after injury. Left, The proteins with the largest increases labeled in progressively darker blues. Wars showed the largest fold-change increase from 1 to 5 d after optic nerve injury. Right, The proteins with the largest decreases are labeled in progressively darker reds. Grk1 showed the largest fold-change decrease from 1 d to 5 d after optic nerve injury. Full data are available in Extended Data Figure 2-3. f, Comparison of changes in 5 d AHA-labeled proteins after optic nerve injury compared with changes in RGC transcriptomics 5 d after optic nerve injury obtained from previously deposited datasets (Gene Expression Omnibus, GSE142881), both normalized by Z-score. Dashed gray lines represent Z-score of ±1.5 for illustrative purposes. Proteins identified as outliers with either increased protein and RNA expression, increased protein and decreased RNA expression, or decreased protein and increased RNA expression after injury are labeled with red dots.
