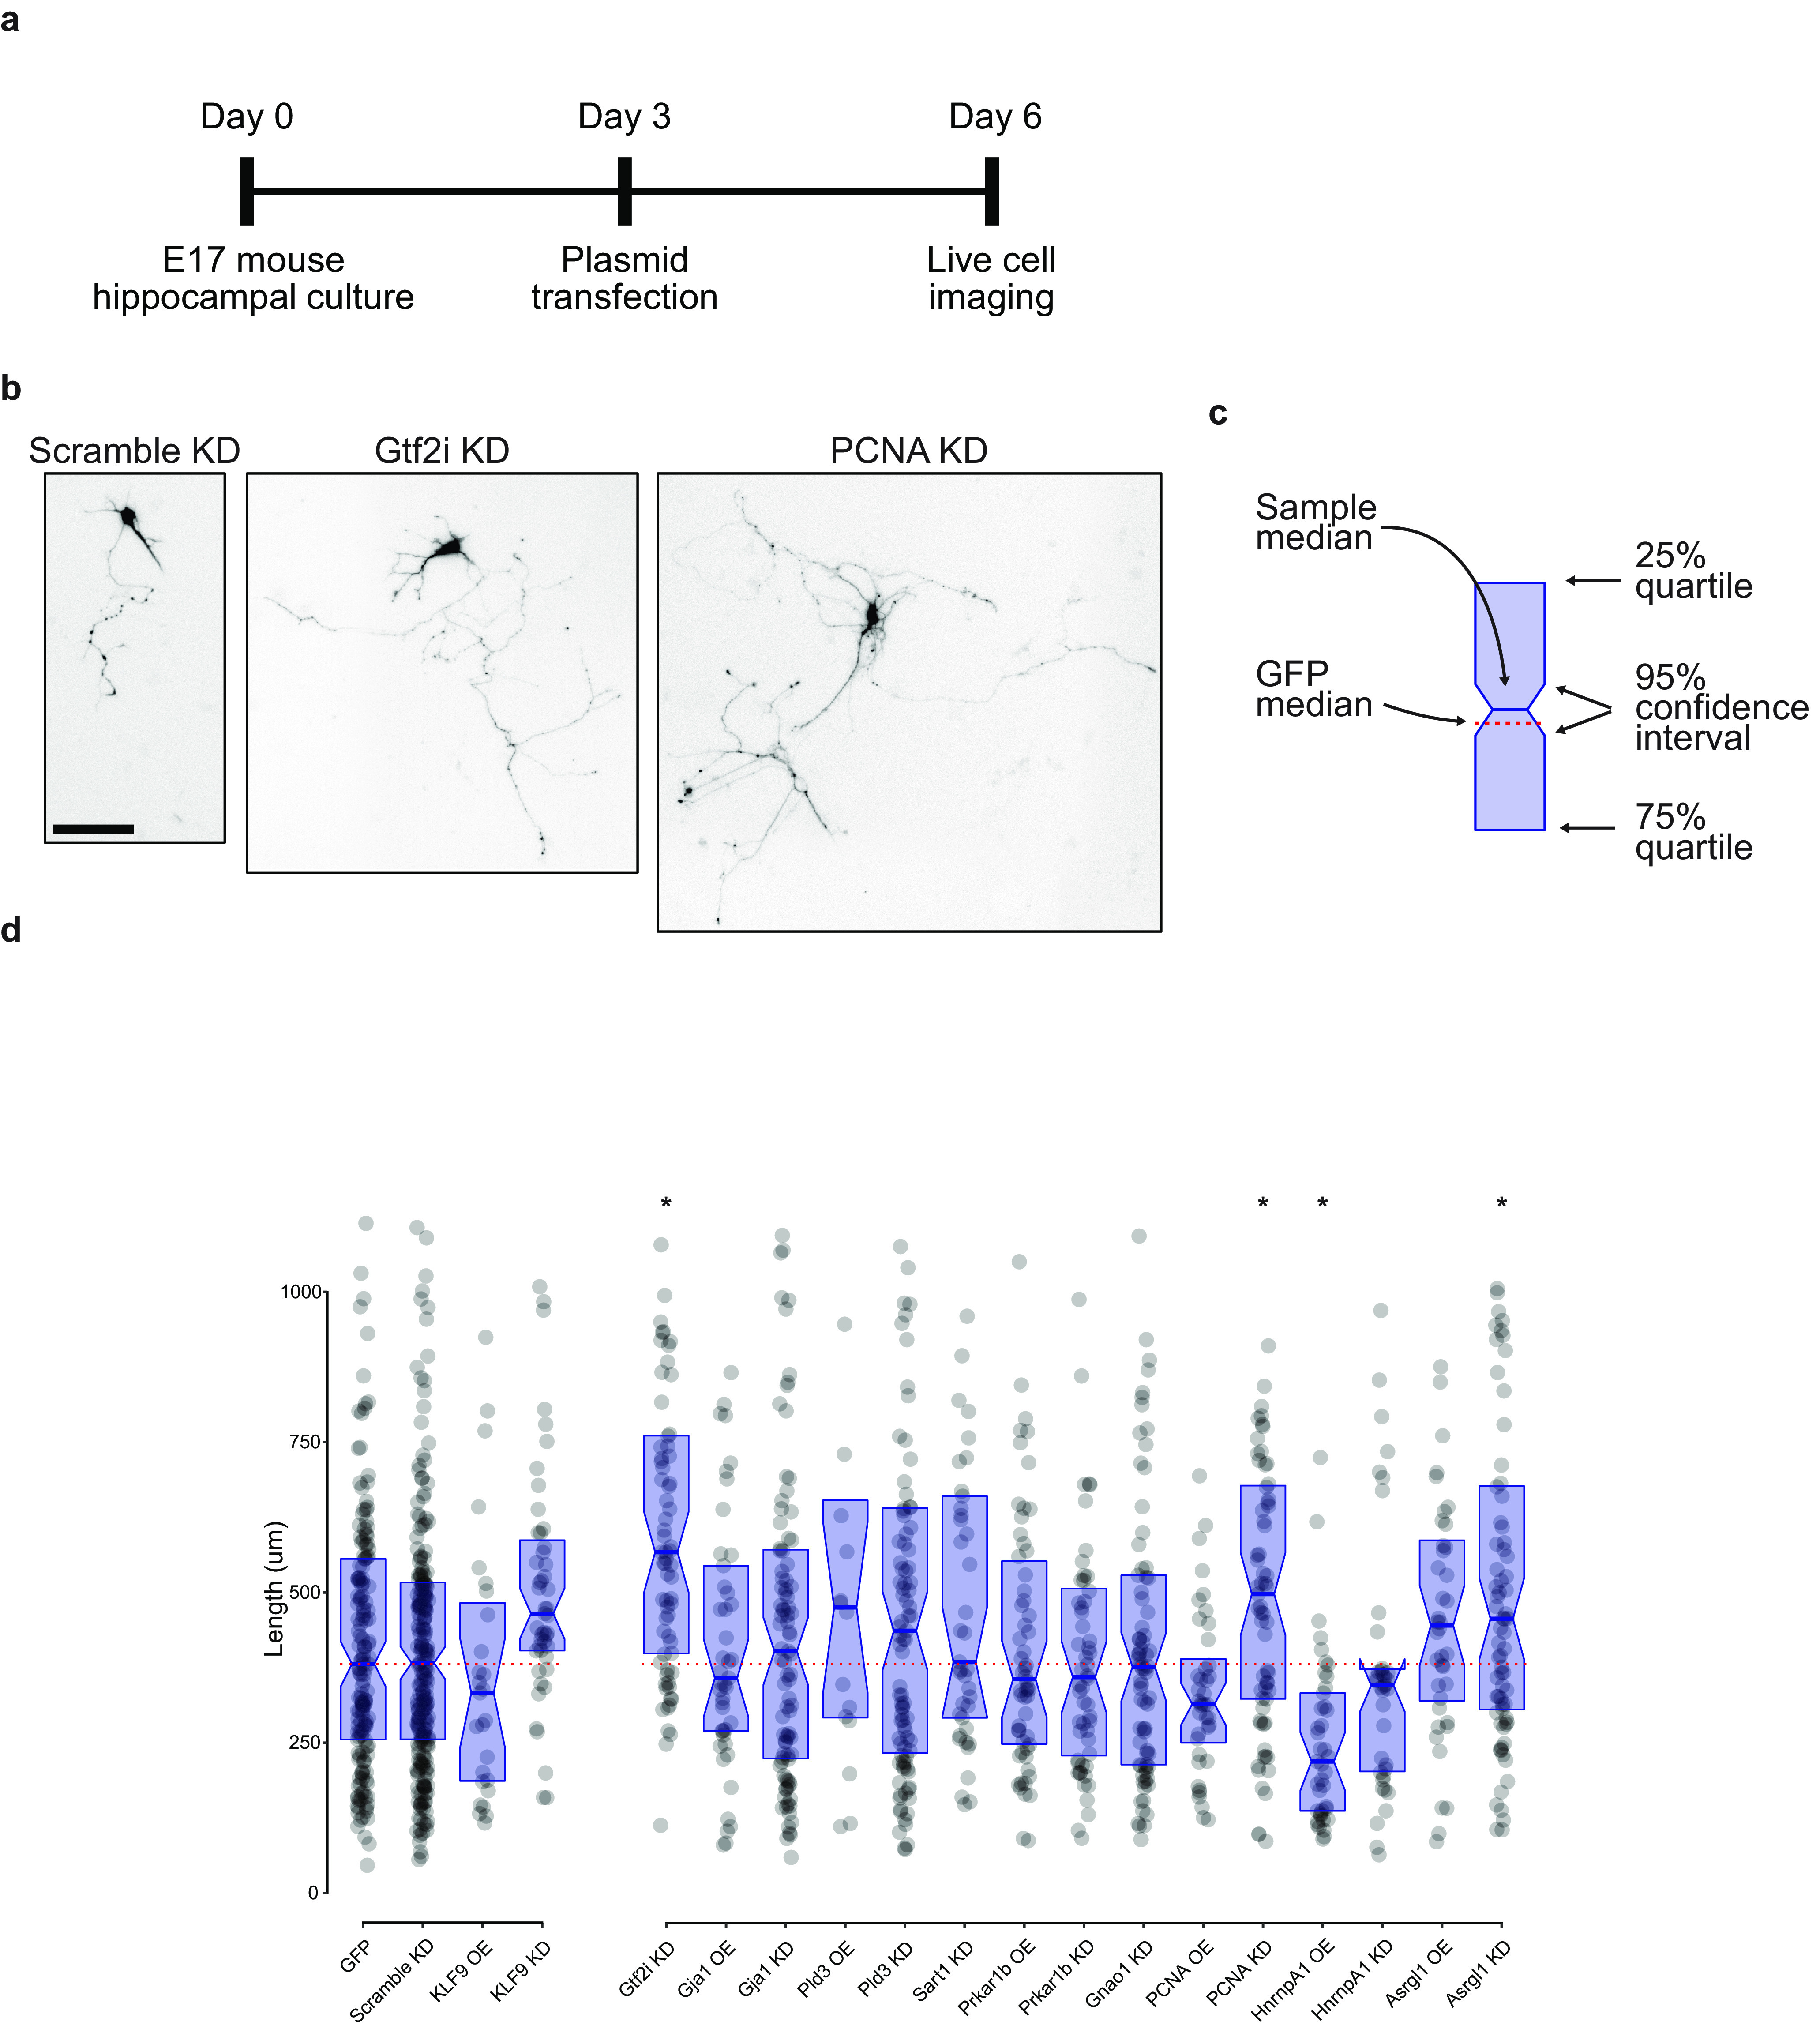
Figure 4.

Quantification of neurite outgrowth with manipulation of proteomic candidates. a, Timeline of in vitro experimental protocol. b, Representative images of neurite length after transfection with three shRNA plasmids, as shown. Scale bar, 100 µm. c, Legend for neurite outgrowth graph. Blue rectangle defines the 25% and 75% interquartile range, with the center blue line as the median. Notches on the rectangle define the 95% confidence interval around the median. The dotted red line is the GFP median to aid in visual comparison across conditions. Raw data are also shown in d as gray dots. d, Comparison of longest neurite lengths with each transfection condition. GFP overexpression and a scrambled shRNA construct served as negative controls, and KLF9 overexpression and knock-down plasmids were used as positive controls. Data points above 1100 µm were excluded from graph but included in statistics and comparisons. Overexpression plasmids were compared using a Kruskal–Wallis test with two-stage linear step-up procedure of Benjamini, Krieger, and Yekutieli controlling the false discovery rate to 0.05 (Benjamini et al., 2006). Knock-down plasmids were similarly compared with the scramble control (Hnrnpa1 OE, *p < 0.01; Gtf2i KD, *p < 0.01; PCNA KD, *p < 0.01; Asrgl1 KD, *p = 0.02) OE, Overexpression; KD, knock-down. Total neurons traced, 1632. Plasmid design data are available in Extended Data Figure 4-1.
