
Figure 3.
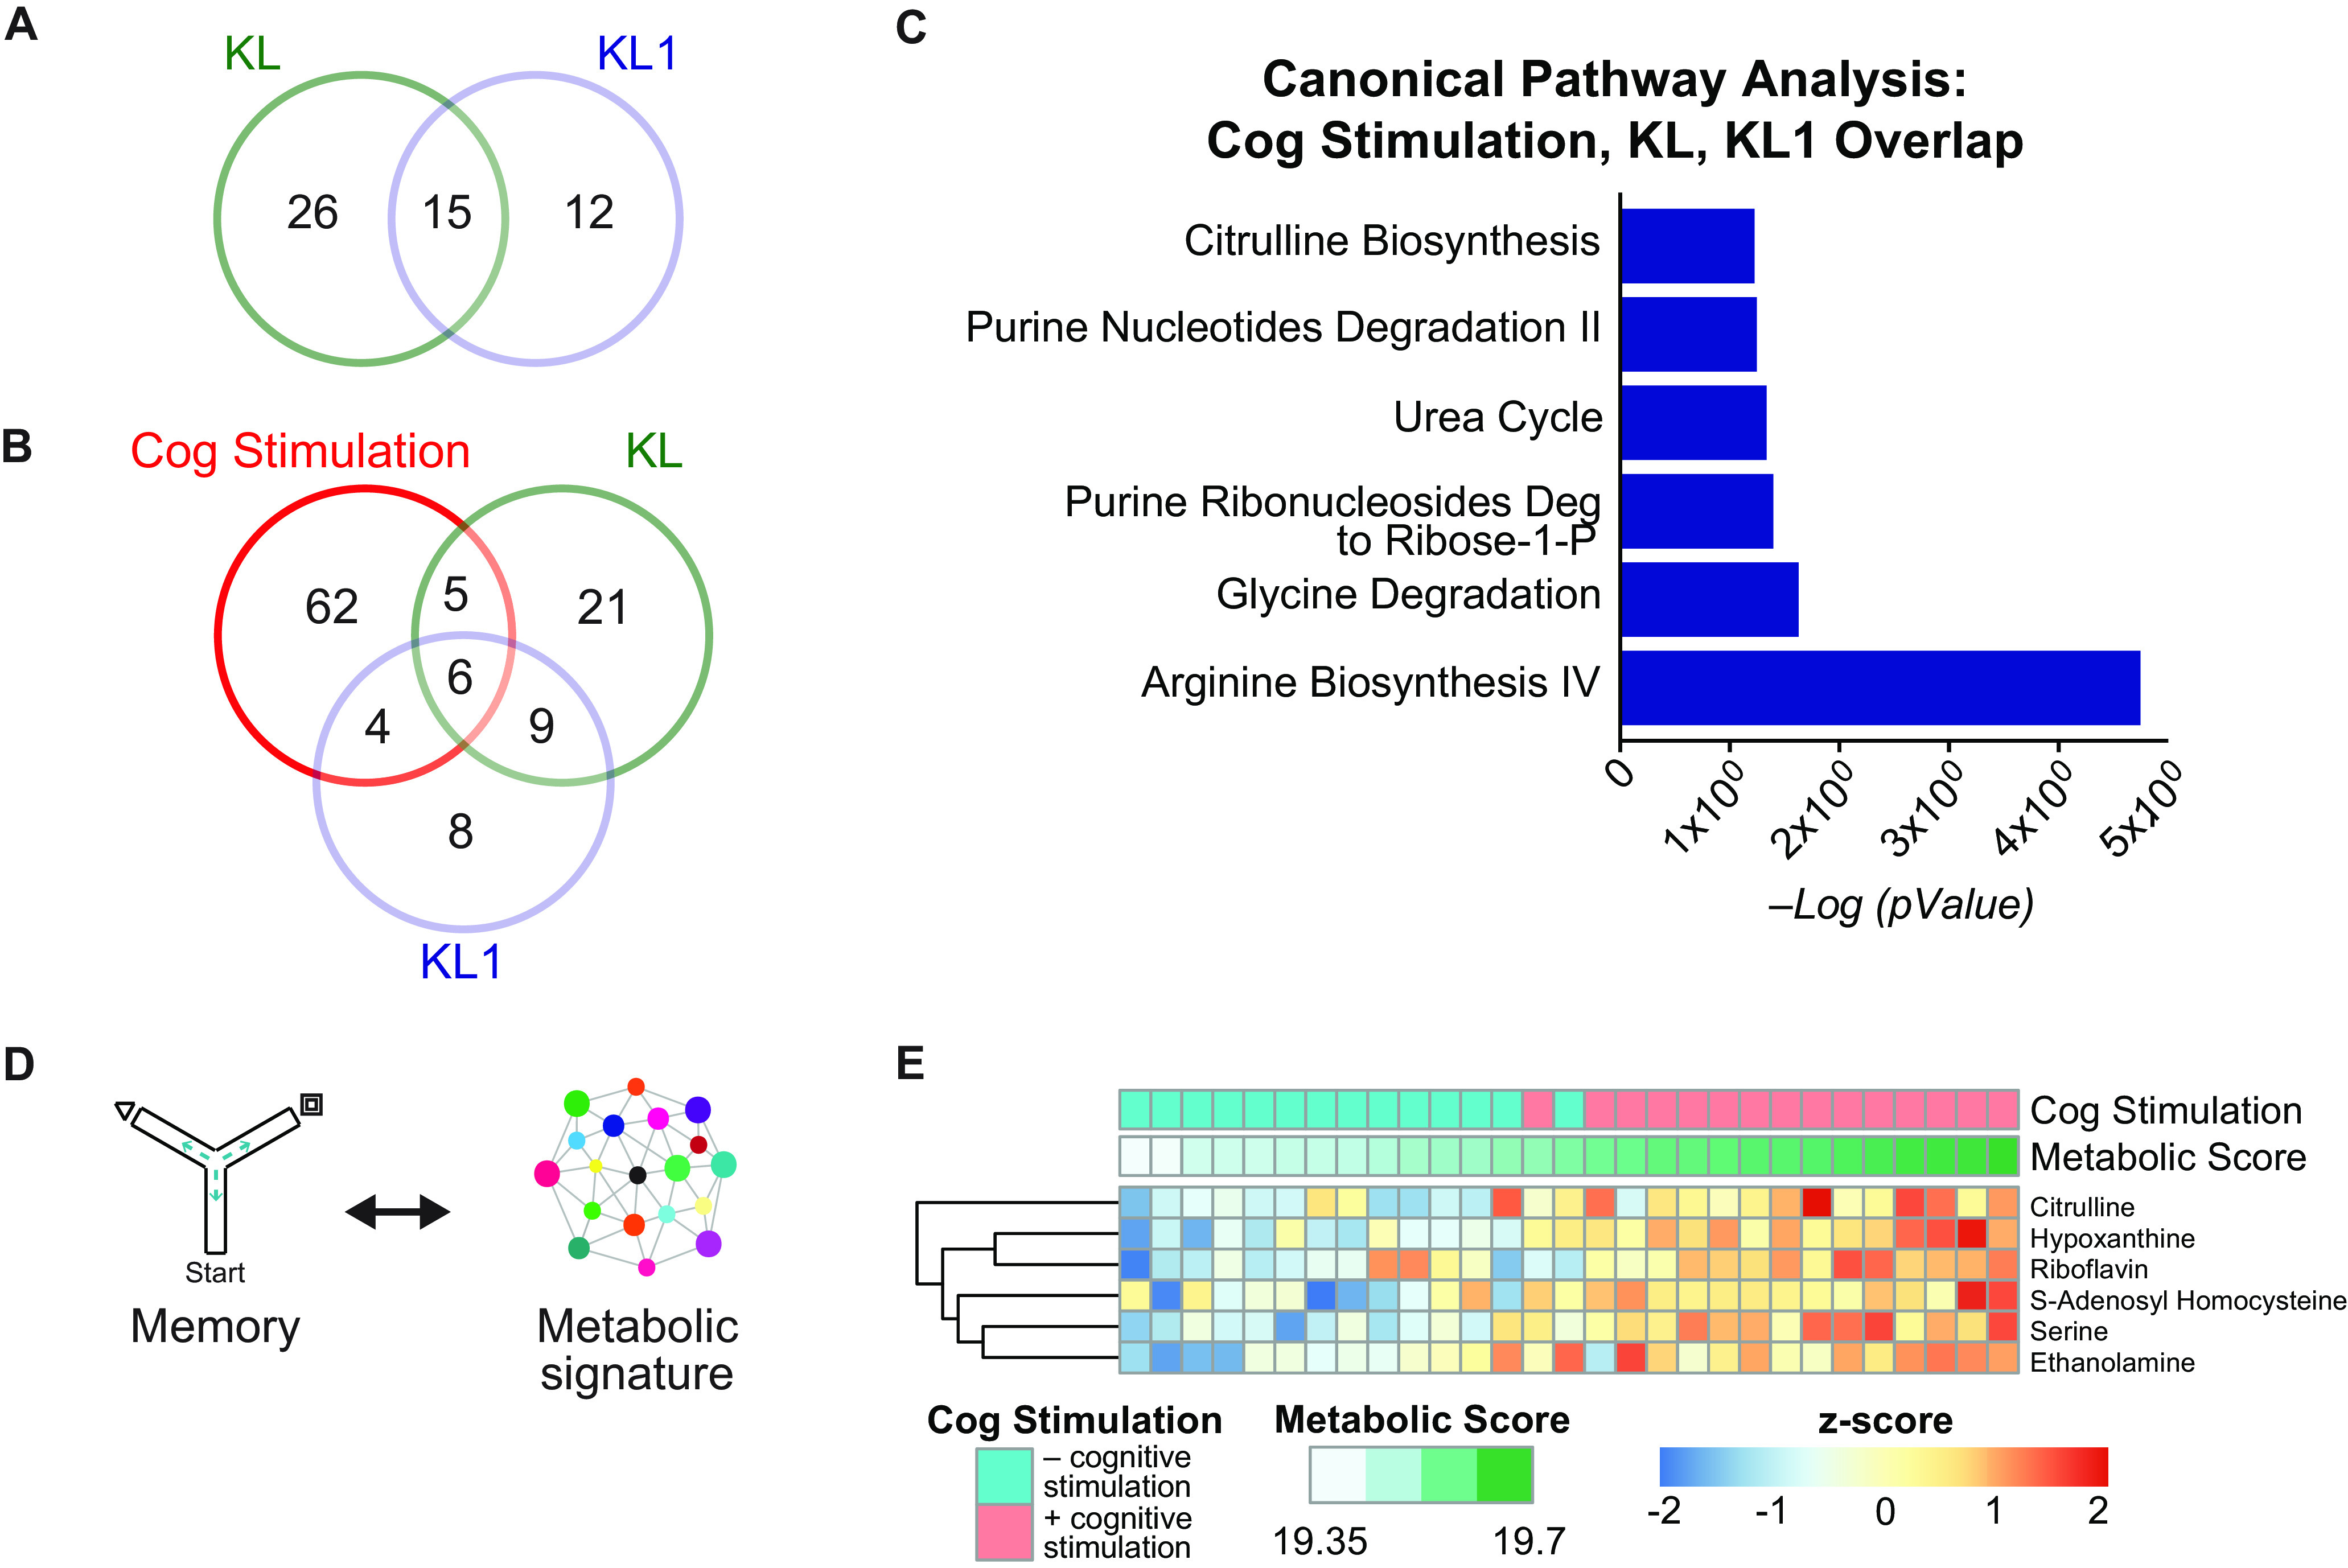
KL and KL1 partially mimic the hippocampal metabolome of cognitive (Cog) stimulation and correlate with cognitive performance. A, Venn diagram showing the overlap between differentially expressed metabolites between KL- and KL1-treated mice. Over 50% of klotho-mediated metabolic changes were recapitulated with KL1 treatment. B, Venn diagram showing the overlap among differentially expressed metabolites in the cognitively stimulated, KL-treated, and KL1-treated mice. Twenty-seven percent of KL-induced metabolites and 37% of KL1-induced metabolites overlapped with cognitive stimulation. C, IPA canonical pathway analysis of the overlapping metabolites among cognitive stimulation, KL, and KL1 shows that a subset (shown) are identical metabolic pathways compared with cognitive stimulation. D, Diagram of approach of mapping cognitive performance to hippocampal metabolomics to generate a metabolic signature of cognition. E, Heatmap of the signature of six common metabolites shared among cognitive stimulation, KL treatment, and KL1 treatment. The signature was used to generate a metabolic score, and cognitively stimulated mice showed an increased metabolic score. Deg, Degradation.