
Figure 3. GDF15 promotes proliferation, migration and invasion of C4-2B cells.
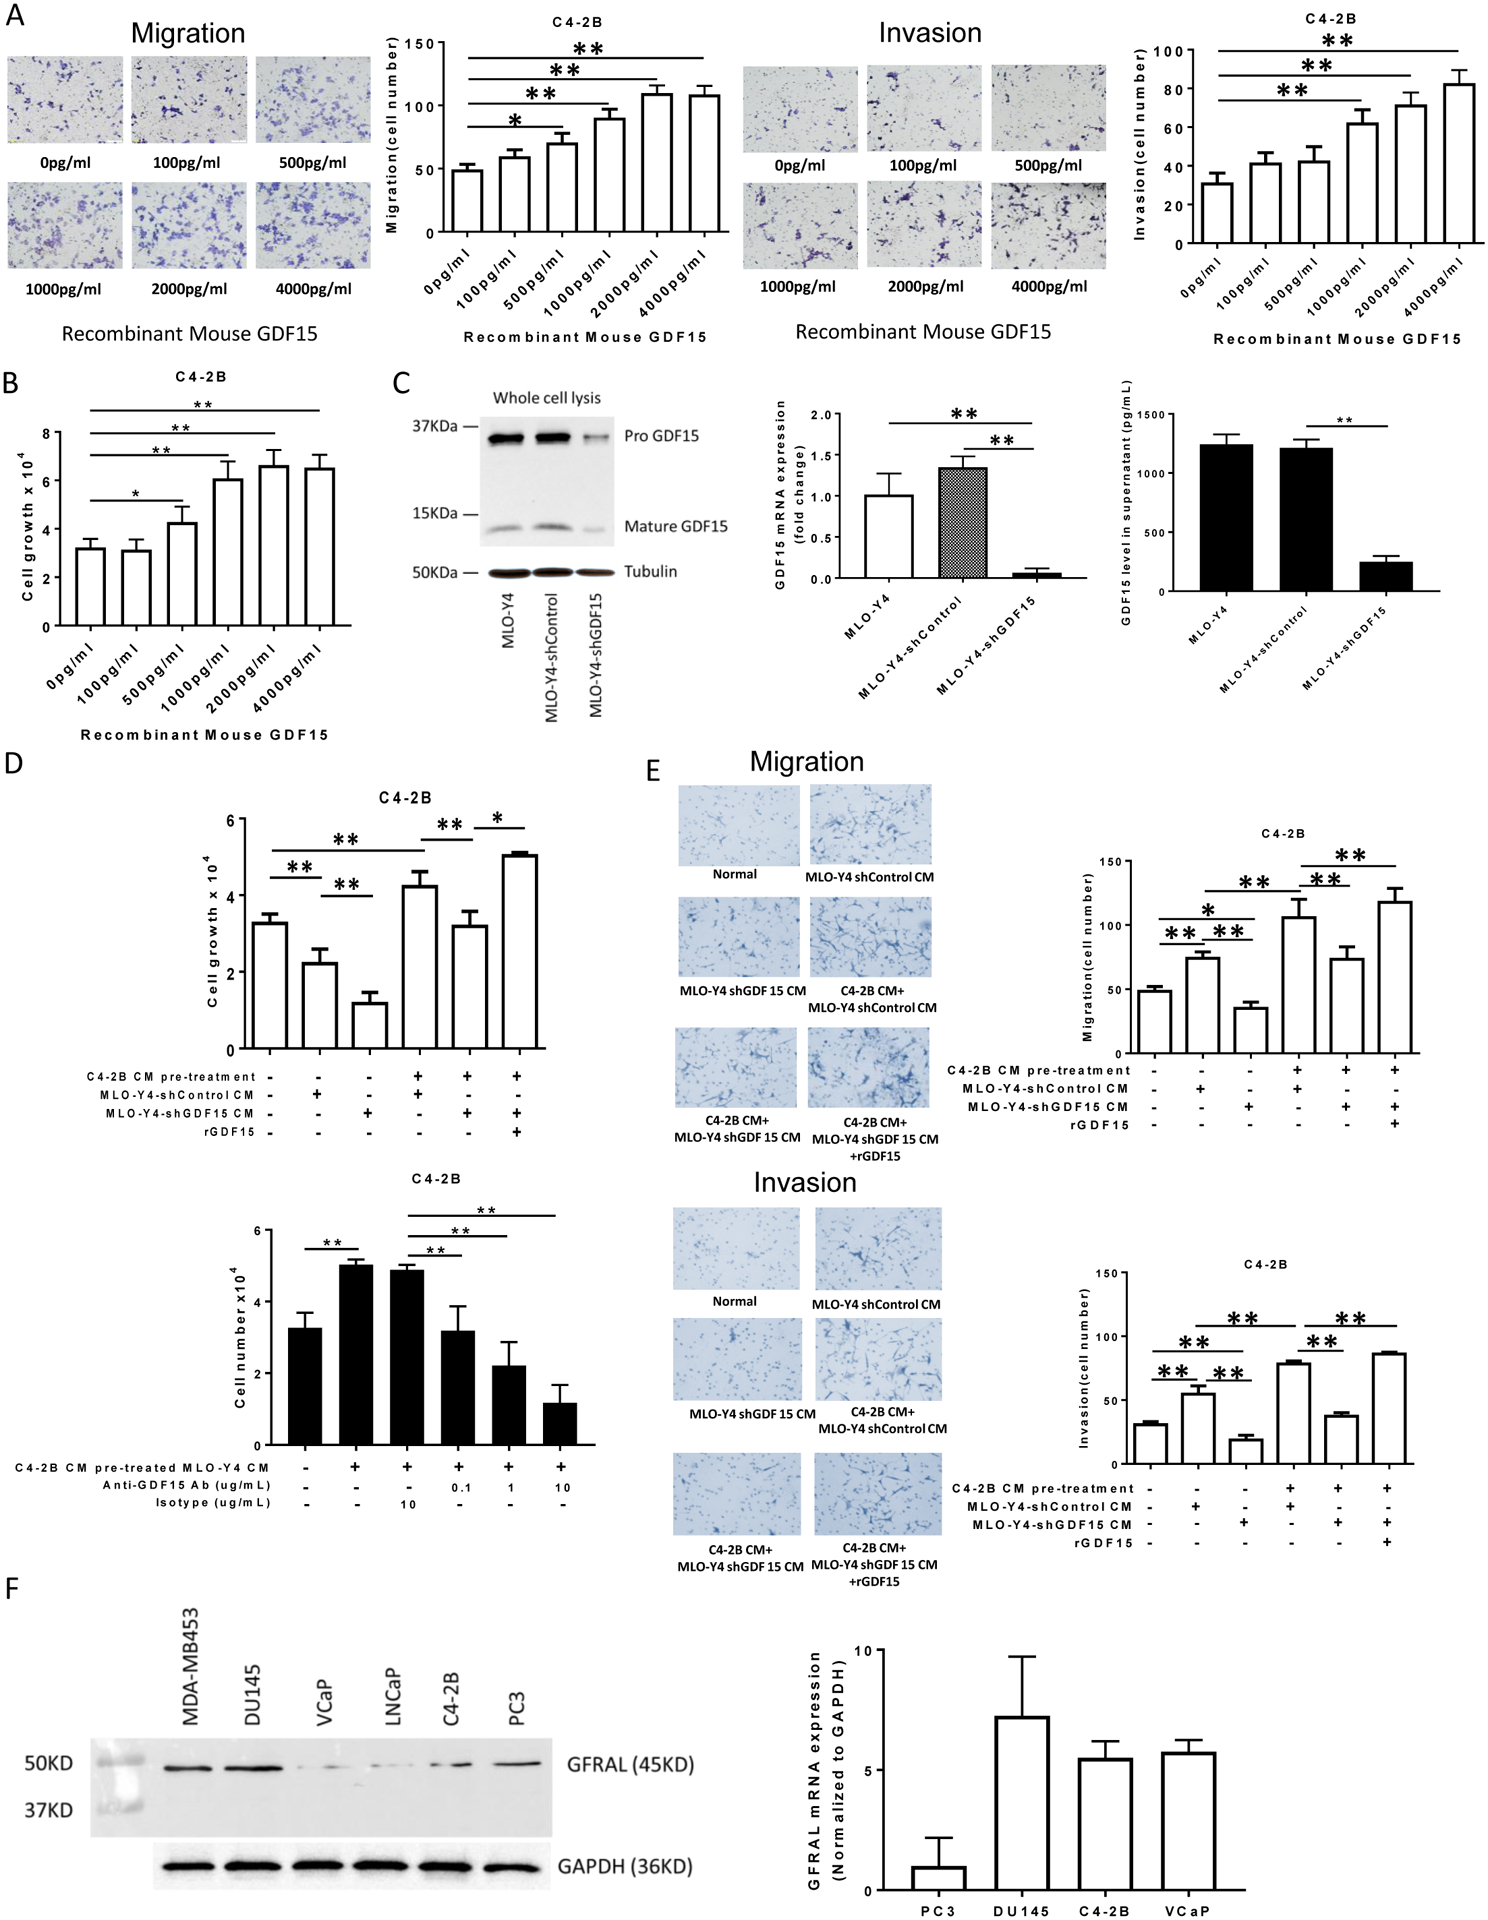
(A). Migration (left figure) and invasion (right figure) were assessed using a transwell assay. C4-2B cells (1.5×10⁵ per cells) were treated with the indicated concentrations of rGDF15 for 24 hours. The membrane was stained using differential Quick staining kit and photographed under light microscopy (20x). The numbers of migrating (no Matrigel on membrane) and invading (Matrigel present on membrane) cells were counted in five random fields for each insert. (B). C4-2B cells (1.5×10⁴ per well) were treated with the indicated concentrations of rGDF15 for 48 hours. Cell numbers were quantified using a hemocytometer. (C). Validation of GDF15 knockdown in MLO-Y4 cells: Total cell protein and RNA were collected and subject to immunoblot (left figure) and real-time PCR (middle graph), respectively. Supernatant was collected from the indicated cells after 24 hours of incubation and subjected to ELISA for GDF15 (right graph). (D). Upper Figure: C4-2B cells (1.5×10⁴ per well) were treated with the indicated CM from the genetically-modified MLO-Y4 cells. In some cases, rGDF15 (500 pg/ml) was added as indicated. After 48 hours, cell numbers were quantified using a hemocytometer. Lower Figure: C4-2B cells (1.5×10⁴ per well) were treated with the indicated CM with the addition of either anti-GDF15 antibody or isotype antibody from the genetically-modified MLO-Y4 cells. After 48 hours, cell numbers were quantified using a hemocytometer. (E). Migration (upper figures) and invasion (lower figures) were assessed using a transwell assay. C4-2B cells (1.5×10⁵ per cells) were treated with CM from untreated or C4-2B CM pre-treated MLO-Y4 cells with knockdown (or control) of GDF15. In some cases, rGDF15 was added to the CM as indicated. After 24 hours, the membrane was stained using differential Quick staining kit and photographed under light microscopy (20x). The numbers of migrating (no Matrigel on membrane) and invading (Matrigel present on membrane) cells were counted in five random fields for each insert. Data are shown as the mean±SD of 3 independent experiments. * P < 0.05; ** P < 0.01. (F). Total protein and RNA from the indicated cell lines were subjected to immunoblot (left figure) and real time PCR (right graph) for GFRAL. The PCR data are shown as the mean±SD of 3 independent experiments.