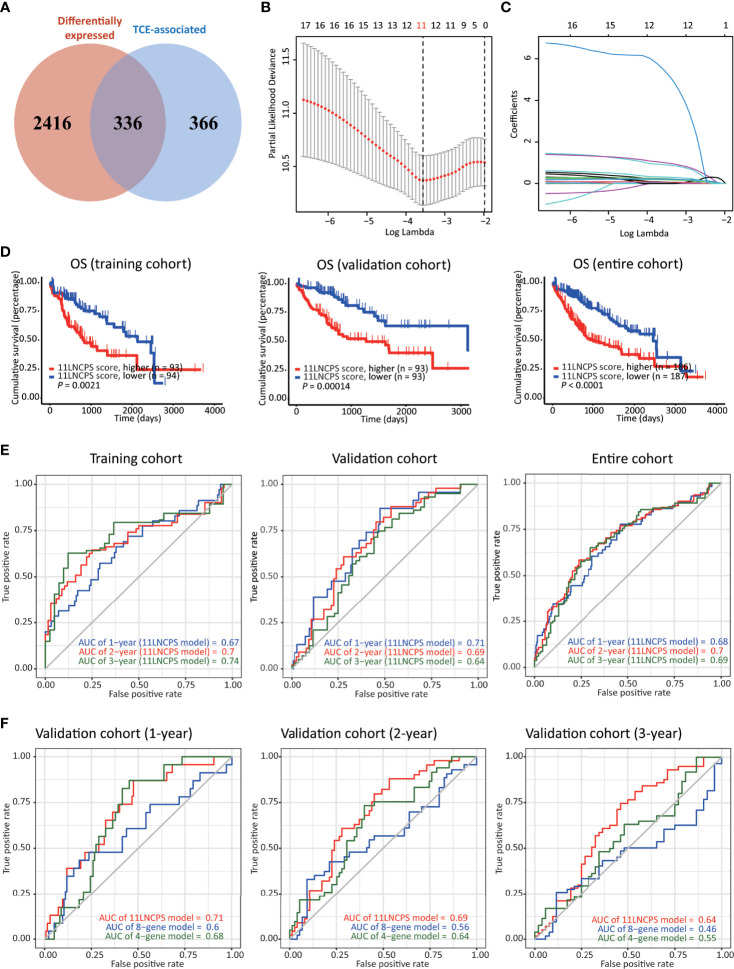
Figure 2.
Construction, validation, and evaluation of an 11-lncRNA signature predictive of prognosis (11LNCPS) in HCC patients. (A) Venn diagram showing the overlapping lncRNAs (n = 336) between lncRNAs differentially expressed in HCC (n = 2752, red) and those associated with T cell exclusion (TCE, n = 702, blue). (B) Partial likelihood deviance of varying numbers of prognostic lncRNAs revealed by the LASSO regression model. The grey lines represent the partial likelihood deviance ± standard error (SE). The two vertical lines represent optimal values based on the minimum criteria and 1-SE criteria. The proper log (Lambda) value was chosen via the minimum criteria. (C) Identification of 11 lncRNAs by the LASSO logistic regression model with non-zero coefficients. (D) The Kaplan–Meier analysis of overall survival (OS) in the training cohort (left), validation cohort (center), and entire cohort (right) cohort of TCGA HCC patients with higher and lower 11LNCPS scores based on the median. The cutoff value of group dividing was the median RS score. (E) Receiver operating characteristic (ROC) curves of the 11LNCPS model for evaluating the predictability of OS in 1, 2, and 3 years in the training cohort (left), validation cohort (center), and entire cohort (right) cohort. (F) Comparison of ROC curves between the 11LNCPS model (red) and the previously established 8-gene model (blue) and 4-gene model (green) for 1, 2, and 3 years OS in the validation cohort.

