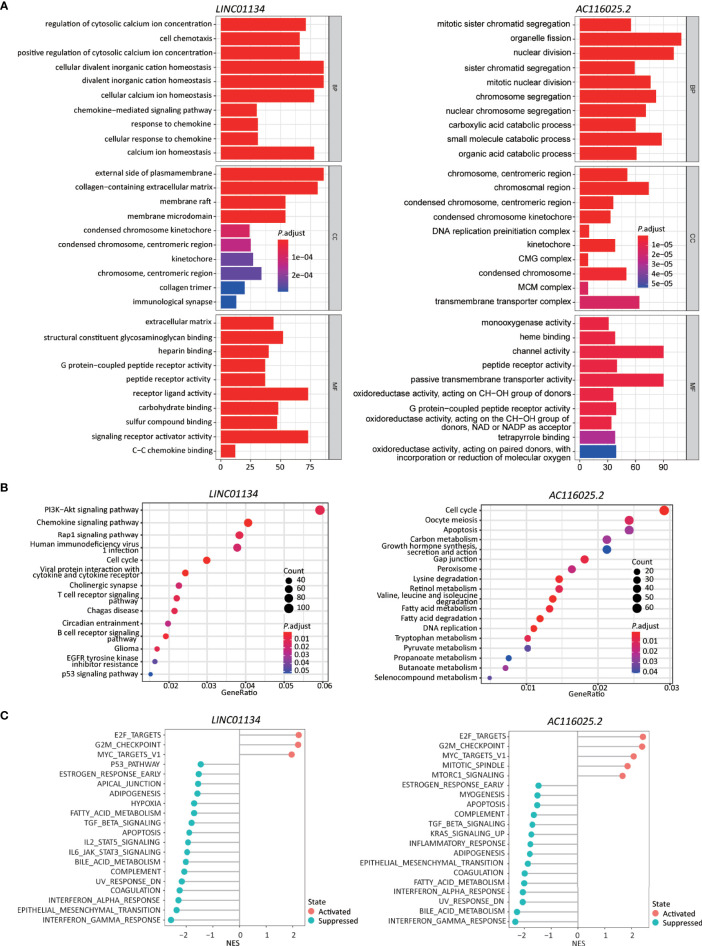
Figure 6.
Higher expression levels of LINC01134 and AC116025.2 are associated with several cancer hallmarks and immunological characteristics of HCC. (A, B) GO enrichment (A) and KEGG pathway (B) analyses between HCCs with higher- and lower-levels of LINC01134 (left in each panel) and AC116025.2 (right in each panel). The heights of bars and sizes of dots represent the count of genes, while the colors represent the adjusted P-value. (C) Significantly enriched cancer hallmarks in HCCs with higher expression levels of LINC01134 (left) and AC116025.2 (right), as analyzed by the GSEA. The red and blue colors of dots indicate a pathway’s activation and suppression, respectively. The x-axis shows normalized enrichment scores (NES). All pathways with P values smaller than 0.05 are shown.

