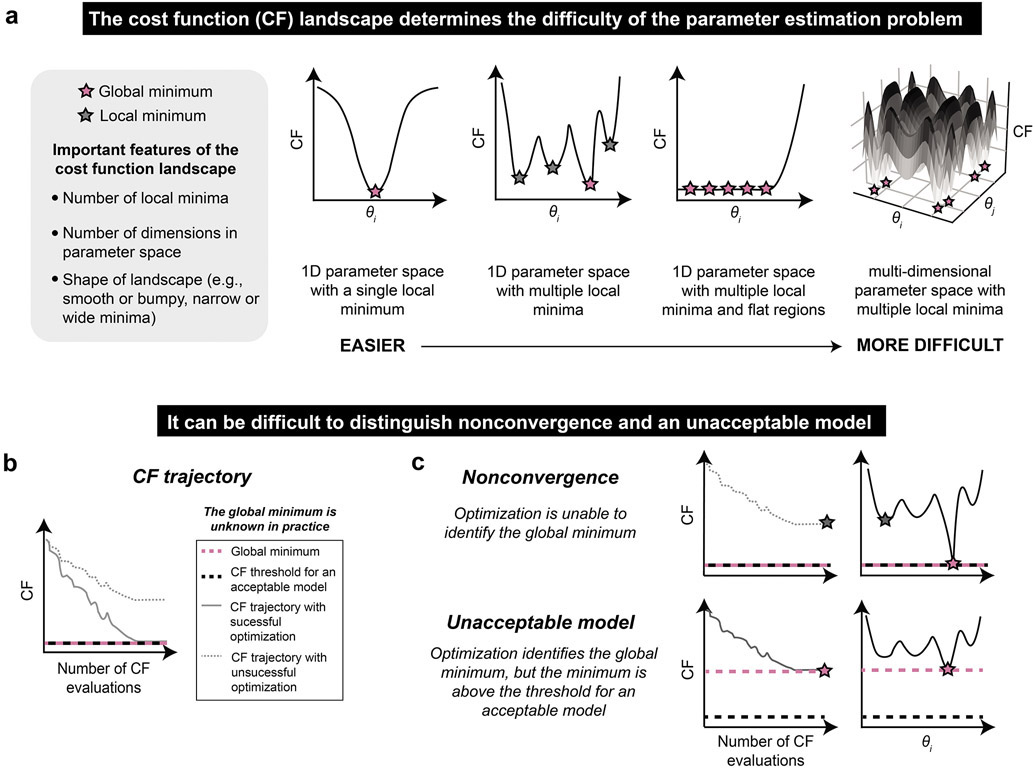
Figure 3. The parameter estimation method should be well-suited to the parameter estimation problem.
(a) Relationship between cost function shape and difficulty of parameter estimation. θi is a free parameter. In the rightmost plot, the shading corresponds to the value of the cost function (z-axis). (b, c) Distinction of nonconvergence and an unacceptable model. (b) A cost function trajectory indicates the value of the cost function at each iteration of the optimization algorithm. A successful optimization will identify a global minimum, although it will not necessarily identify all global minima. An acceptable model (i.e., parameter set) will yield a cost function value that is less than or equal to some threshold. (c) If the optimization algorithm does not converge (top), then global minima of the model (pink) cannot be found and instead a local minimum (gray) is identified. If the model is unacceptable (bottom), then a global minimum of the cost function is found (pink), but this minimum is too large to meet the cost function threshold predetermined to define an acceptable model (black dotted line). In practice, the global minimum is unknown and therefore these situations are indistinguishable (or could occur simultaneously).

