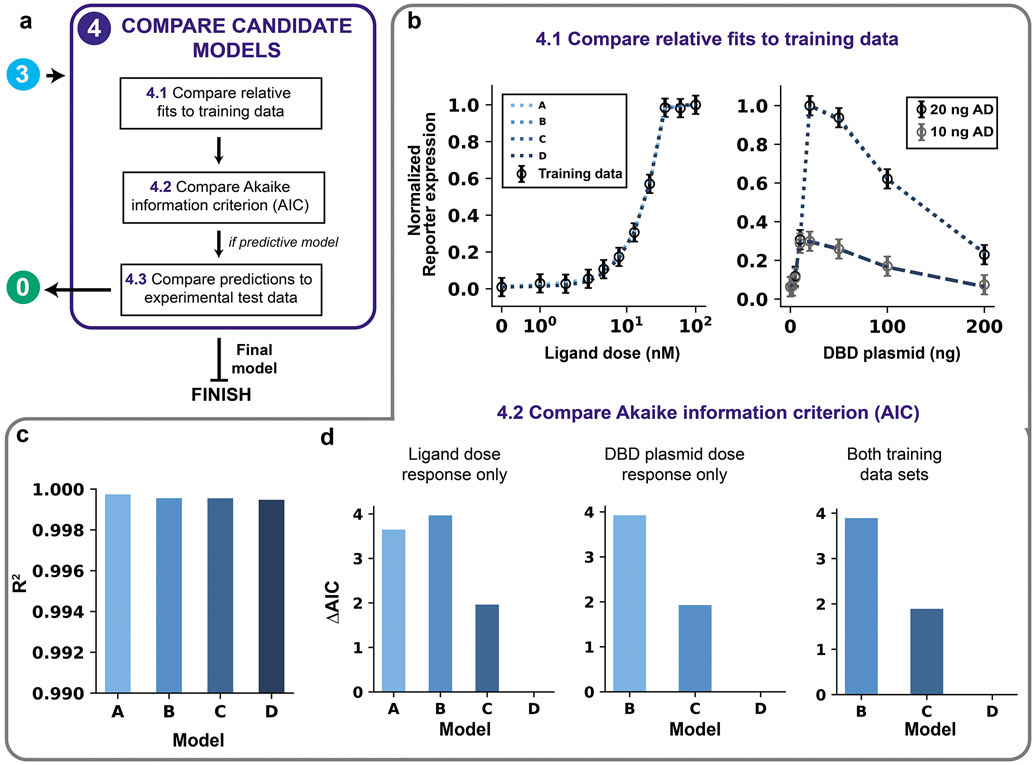
Figure 9. Compare candidate models.
(a) Module 4 workflow for model comparison. If competing models remain after parameter identifiability analysis, then the models are compared on the fit to training data using both the AIC and comparison of predictions (if the model aims to be predictive). (b–d) Module 4 case study for a hypothetical crTF. (b) Comparison of the relative fits to training data for Models A, B, C, and D (simulations overlap). (c) Comparison of quantitative fit to training data based on R2. A high R2 (max = 1) is ideal. (d) Comparison of AIC differences for using AIC calculated with ligand dose response data only (left), DBD plasmid dose response data only (middle), and both data sets (right).

