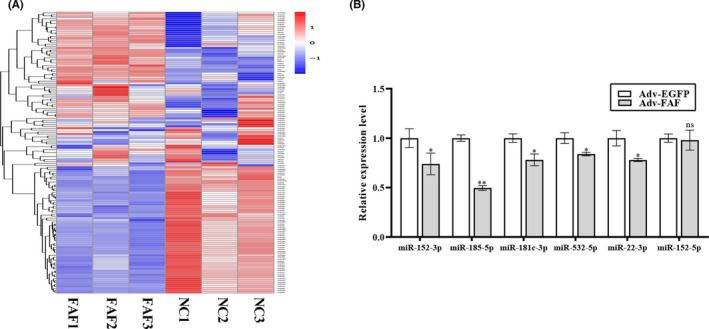
FIGURE 4.

Expression profile of miRNAs in the FAF‐overexpressing NRCM and validation of potential target miRNAs. NRCM were transfected with Adv‐FAF and Adv‐EGFP, respectively. Subsequently, total RNA was extracted, and small RNA sequencing was performed to detect differentially expressed miRNAs in FAF‐overexpressing cardiomyocytes. (A) Heat map of the differentially expressed miRNAs between the control and FAF‐overexpressing groups. Relative expression levels are shown by the colour change. Higher expression is shown in red, whereas lower expression is shown in blue. (B) The expression levels of candidate miRNAs in Adv‐FAF‐transfected NRCM were determined by qRT‐PCR. n = 3, *p < 0.05, **p < 0.01, vs the Adv‐EGFP group
