FIGURE 4.

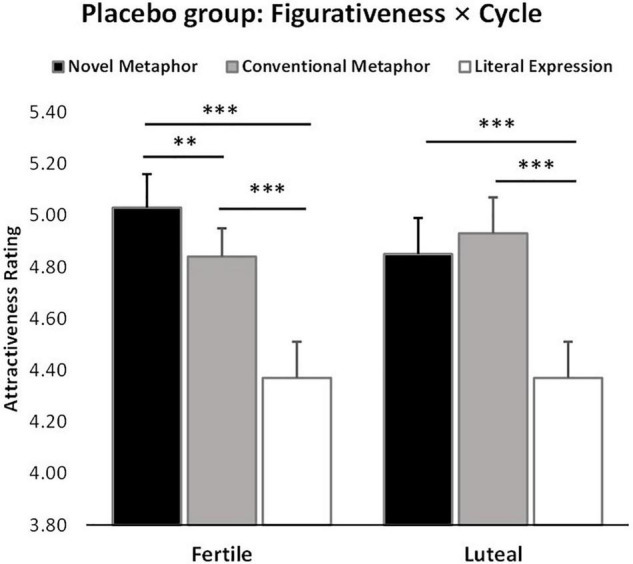
Cycle × figurativeness interaction effect on attractiveness ratings independent of treatment (n = 62). **p < 0.01, ***p < 0.001, two-tailed t-test. Bars indicate M ± SE.

Cycle × figurativeness interaction effect on attractiveness ratings independent of treatment (n = 62). **p < 0.01, ***p < 0.001, two-tailed t-test. Bars indicate M ± SE.