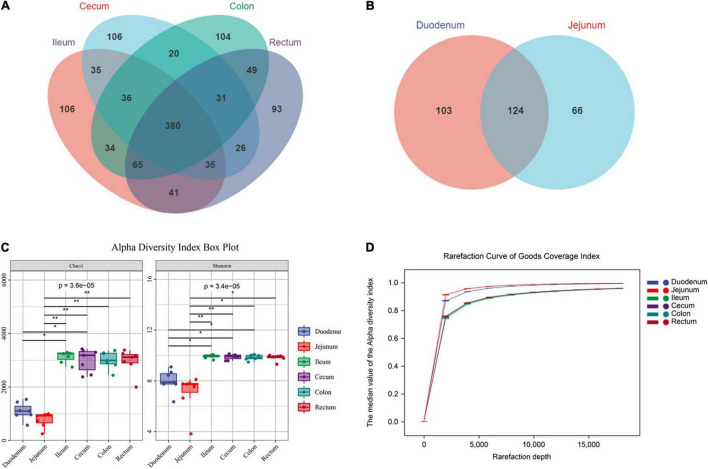
FIGURE 2.
Sequencing results and statistical analysis of diversity. (A) Venn diagram showing the OTUs shared among the hindgut segments. (B) Venn diagram showing the OTUs shared between the foregut segments. (C) The Chao1 and Shannon indices of six intestinal segments. Significantly different indices were tested by Kruskal-Wallis test with adjusted *P value of < 0.05, **P > 0.01. (D) Rarefaction curve of Good’s coverage index. Each curve represents the mean within the group.

