Fig. 1.
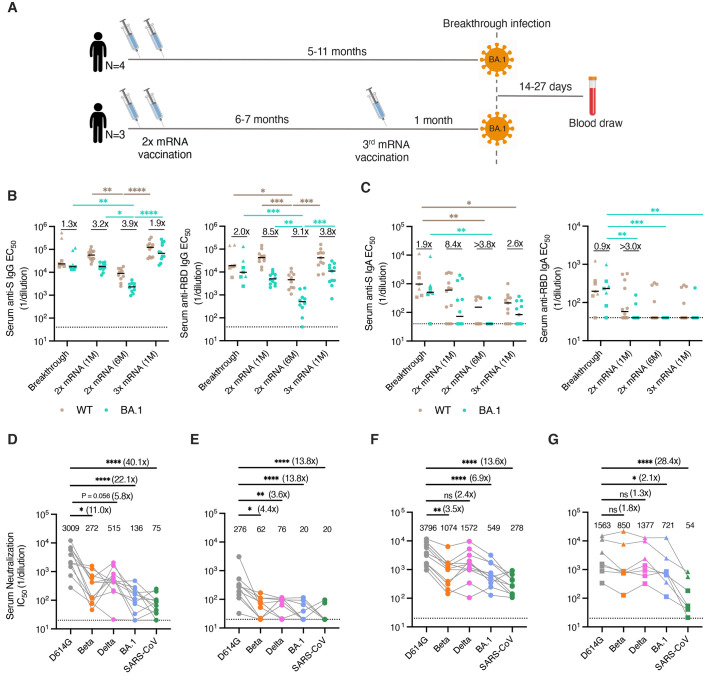
Serum binding and neutralizing activity following BA.1 breakthrough infection. (A) Vaccination, infection, and blood draw timelines. (B-C) Serum (B) IgG and (C) IgA reactivity with recombinant WT and BA.1 (left) Hexapro-stabilized S proteins and (right) RBDs following BA.1 breakthrough infection. Serum samples from uninfected/vaccinated donors at one month or six months following primary vaccination (2x mRNA) or one month following booster mRNA vaccination (3x mRNA) are shown for comparison. The fold change in median EC50 against BA.1 relative to D614G is shown above each paired set of measurements. Black bars represent median binding EC50 titers. Dotted lines represent the lower limit of detection. (D-G) Serum neutralizing activity against SARS-CoV-2 D614G, Beta, Delta, and BA.1 and SARS-CoV (D) one month after primary mRNA vaccination (n=12), (E) six months after primary mRNA vaccination (n=10), (F) one month after mRNA booster vaccination (n=11), and (G) 14 to 27 days after BA.1 breakthrough infection (n=7), as measured using an MLV-based pseudovirus neutralization assay. Plotted values represent serum neutralizing IC50 titers and values shown above the data points indicate the median IC50 titer. The fold change in IC50 titer for each virus relative to D614G is shown in parentheses. Breakthrough infection donors infected after primary mRNA vaccination (n=4) are shown as squares and those infected after mRNA booster vaccination (n=3) are shown as triangles. Statistical comparisons were determined by (B-C) two-sided Kruskal-Wallis test with Dunn's multiple comparisons or (D) Friedman's test with multiple comparisons. 1M, one month; 6M, six months; EC50, 50% effective concentration; IC50, 50% inhibitory concentration; WT, wild type. *P < 0.05, **P < 0.01, ***P < 0.001, ****P < 0.0001.

