Fig. 3.
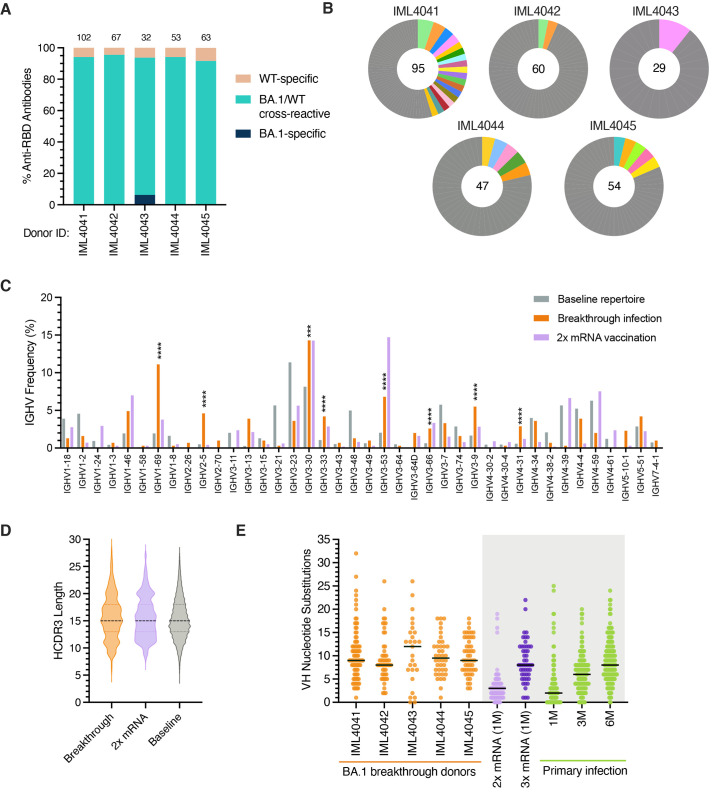
Sequence features of RBD-directed monoclonal antibodies isolated from BA.1 breakthrough infection donors. (A) Proportion of antibodies that bind recombinant WT and/or BA.1 RBD antigens from each donor, as determined by IgG binding via biolayer interferometry (BLI). Antibodies were isolated from breakthrough infection donors after two-dose vaccination (IML4041 through IML4044) or three-dose vaccination (IML4045). The number of antibodies isolated from each donor is indicated at the top of each bar. (B) Clonal lineage analysis of BA.1-reactive B cells. Clonally expanded lineages are represented as colored slices, with each differentially colored slice representing a separate lineage and the size of the slice proportional to the lineage size. Unique clones are combined and shown as a single grey segment. The total number of antibodies is shown in the center of each pie. (C) Germline IGHV gene usage frequencies among anti-RBD antibodies derived from breakthrough infection donors. Anti-RBD antibodies isolated from mRNA-vaccinated donors (purple bars) were obtained from the CoV-AbDab database ( 45 ). Unselected (baseline) memory B cell repertoires (grey bars) are included for reference ( 22 ). (D) Distribution of HCDR3 amino acid lengths in BA.1-reactive antibodies. Antibodies isolated from two-dose mRNA vaccinated individuals (from CoV-AbDab) and baseline human repertoire antibodies are shown for reference ( 22 , 45 ). The dotted black line represents the median, and the lower and upper lines represent the first and third quartile, respectively. (E) Somatic hypermutation levels are shown as the number of VH nucleotide substitutions in antibodies isolated from each breakthrough infection donor (orange), with medians shown by black bars. Antibodies isolated one month after two-dose mRNA vaccination (light green); one month after three-dose mRNA vaccination (dark green); and one, three, or six months after primary D614G infection (purple) are shown for comparison ( 21 ). Statistical significance was determined by Fisher's exact test compared to the baseline repertoire. 1M, one month; 3M, three months; 6M, six months; CDR, complementarity determining region; IGHV, immunoglobulin heavy variable domain; VH, variable heavy chain; WT, wild type. ***P < 0.001, ****P < 0.0001.

