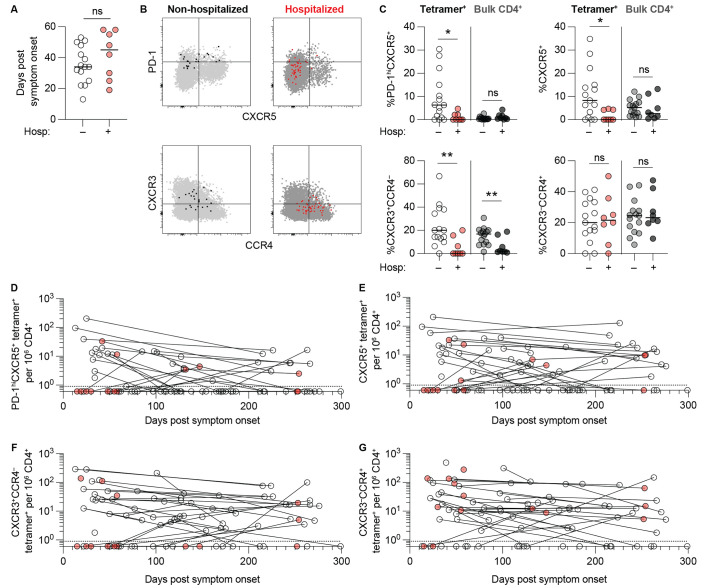
Fig. 4. CD4+ T cell phenotypic differences between non-hospitalized and previously hospitalized patients.
(A) Comparison of timing of sample collection of non-hospitalized (n = 15) and previously hospitalized (n = 8) subjects for phenotypic comparisons. (B) Representative PD-1 x CXCR5 staining (top row) and CXCR3 x CCR4 staining (bottom row) of live CD4+ T cell events. The left column represents an example of a non-hospitalized subject with combined tetramer+ (bound fraction, black) and tetramer– bulk CD4+ (unbound fraction, light gray) gated cells. The right column represents a previously hospitalized subject with combined tetramer+ (bound fraction, red) and tetramer– bulk CD4+ (unbound fraction, dark gray) gated cells. (C) Percentages of PD-1hiCXC5+, CXCR5+, CXCR3+CCR4–, and CXCR3–CCR4+ cells within combined tetramer+ and bulk (tetramer–) CD4+ T cells from non-hospitalized and previously hospitalized subjects. Horizontal lines indicate median values. Statistics by Mann-Whitney tests. *p < 0.05, **p < 0.01. ns = not statistically significant. (D-G) Scatter plots illustrating changes in combined tetramer+ PD-1hiCXC5+ (D), CXCR5+ (E), CXCR3+CCR4– (F), and CXCR3–CCR4+ (G) cells per million CD4+ T cells over time. Lines connect datapoints from the same subjects.

