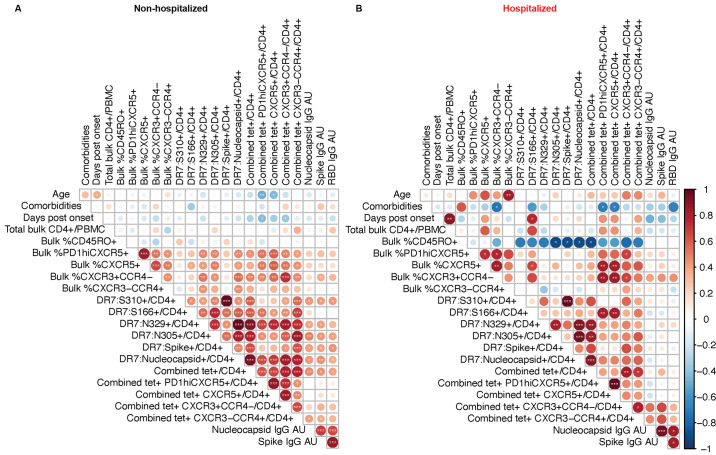
Fig. 5. Associations between SARS-CoV-2 epitope-specific CD4+ T cell and antibody responses.
(A-B) Correlation matrices from non-hospitalized (n = 31) (A) or previously hospitalized (n = 9) (B) subjects displaying Spearman rank order correlation values indicated by circle size and color from red (1) to blue (-1) and p values indicated by white asterisks. *p < 0.05, **p <0.01, ***p < 0.001. Data represents the first time point of collection for each subject (ranging from day 13 to day 181 post symptom onset). Most subjects had all parameters measured, but a few subjects had 1-2 data points that were not collected (as detailed in Table S4). Comorbidity indices were defined by the number of conditions considered high risk for severe disease as listed by the Centers for Disease Control and Prevention.

