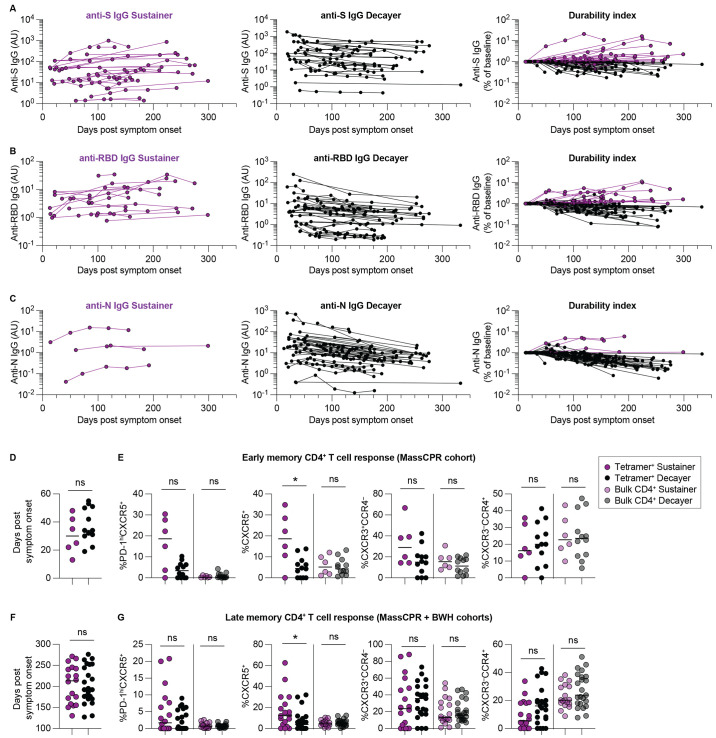
Fig. 6. Increased cTfh responses associated with sustained antibody responses.
(A-C) Longitudinal analysis illustrating changes in anti-S IgG (A), anti-RBD IgG (B) and anti-N IgG (C) antibodies over time from combined MassCPR and BWH cohorts (n = 53). Left column illustrates antibody sustainers (purple), middle column illustrates antibody decayers (black), and right column indicates antibody durability indices of both sustainers and decayers. (D) Comparison of timing of sample collection of PBMC from antibody sustainers (n = 6) and antibody decayers (n = 12) for CD4+ T cell phenotype comparisons at early convalescent time points. (E) Percentages of PD-1hiCXC5+, CXCR5+, CXCR3+CCR4– and CXCR3–CCR4+ positive cells within combined tetramer+ and tetramer– bulk CD4+ T cells from sustainers and decayers at early convalescent time points. (F) Comparison of timing of sample collection of PBMC from antibody sustainers (n = 18) and antibody decayers (n = 23) for phenotypic comparisons at late convalescent time points. (G) Percentages of PD-1hiCXC5+, CXCR5+, CXCR3+CCR4– and CXCR3–CCR4+ positive cells within combined tetramer+ and tetramer– bulk CD4+ T cells from sustainers and decayers at late convalescent time points. Horizontal lines indicate median values. Statistics by Mann-Whitney tests. *p < 0.05. ns = not statistically significant.

