. 2022 May 12;130(5):057007. doi: 10.1289/EHP10054

Figure 3.

Figure 3 is a set of two box plots, plotting Personal Carbon Monoxide (parts per million), ranging as 10 begin superscript 0 end superscript and 10 begin superscript 1 end superscript, and Personal particulate matter begin subscript 2.5 end subscript (microgram per meter cubed), ranging as 10 begin superscript 1 end superscript and 10 begin superscript 2 end superscript (y-axis) across Baseline: L P G 79 participants and control 81 participants; Month 3: L P G 76 participants and control 79 participants; Month 6: L P G 79 participants and control 81 participants; Month 12: L P G 79 participants and control 81 participants; Month 18: L P G 80 participants and control 75 participants; and Month 24: L P G 76 participants and control 73 participants, and Baseline: L P G 90 participants and control 90 participants; Month 3: L P G 90 participants and control 87 participants; Month 6: L P G 89 participants and control 90 participants; Month 12: L P G 87 participants and control 90 participants; Month 18: L P G 88 participants and control 90 participants; and Month 24: L P G 84 participants and control 85 participants (x-axis) for World Health Organization 24 hours guideline.

PM2.5 
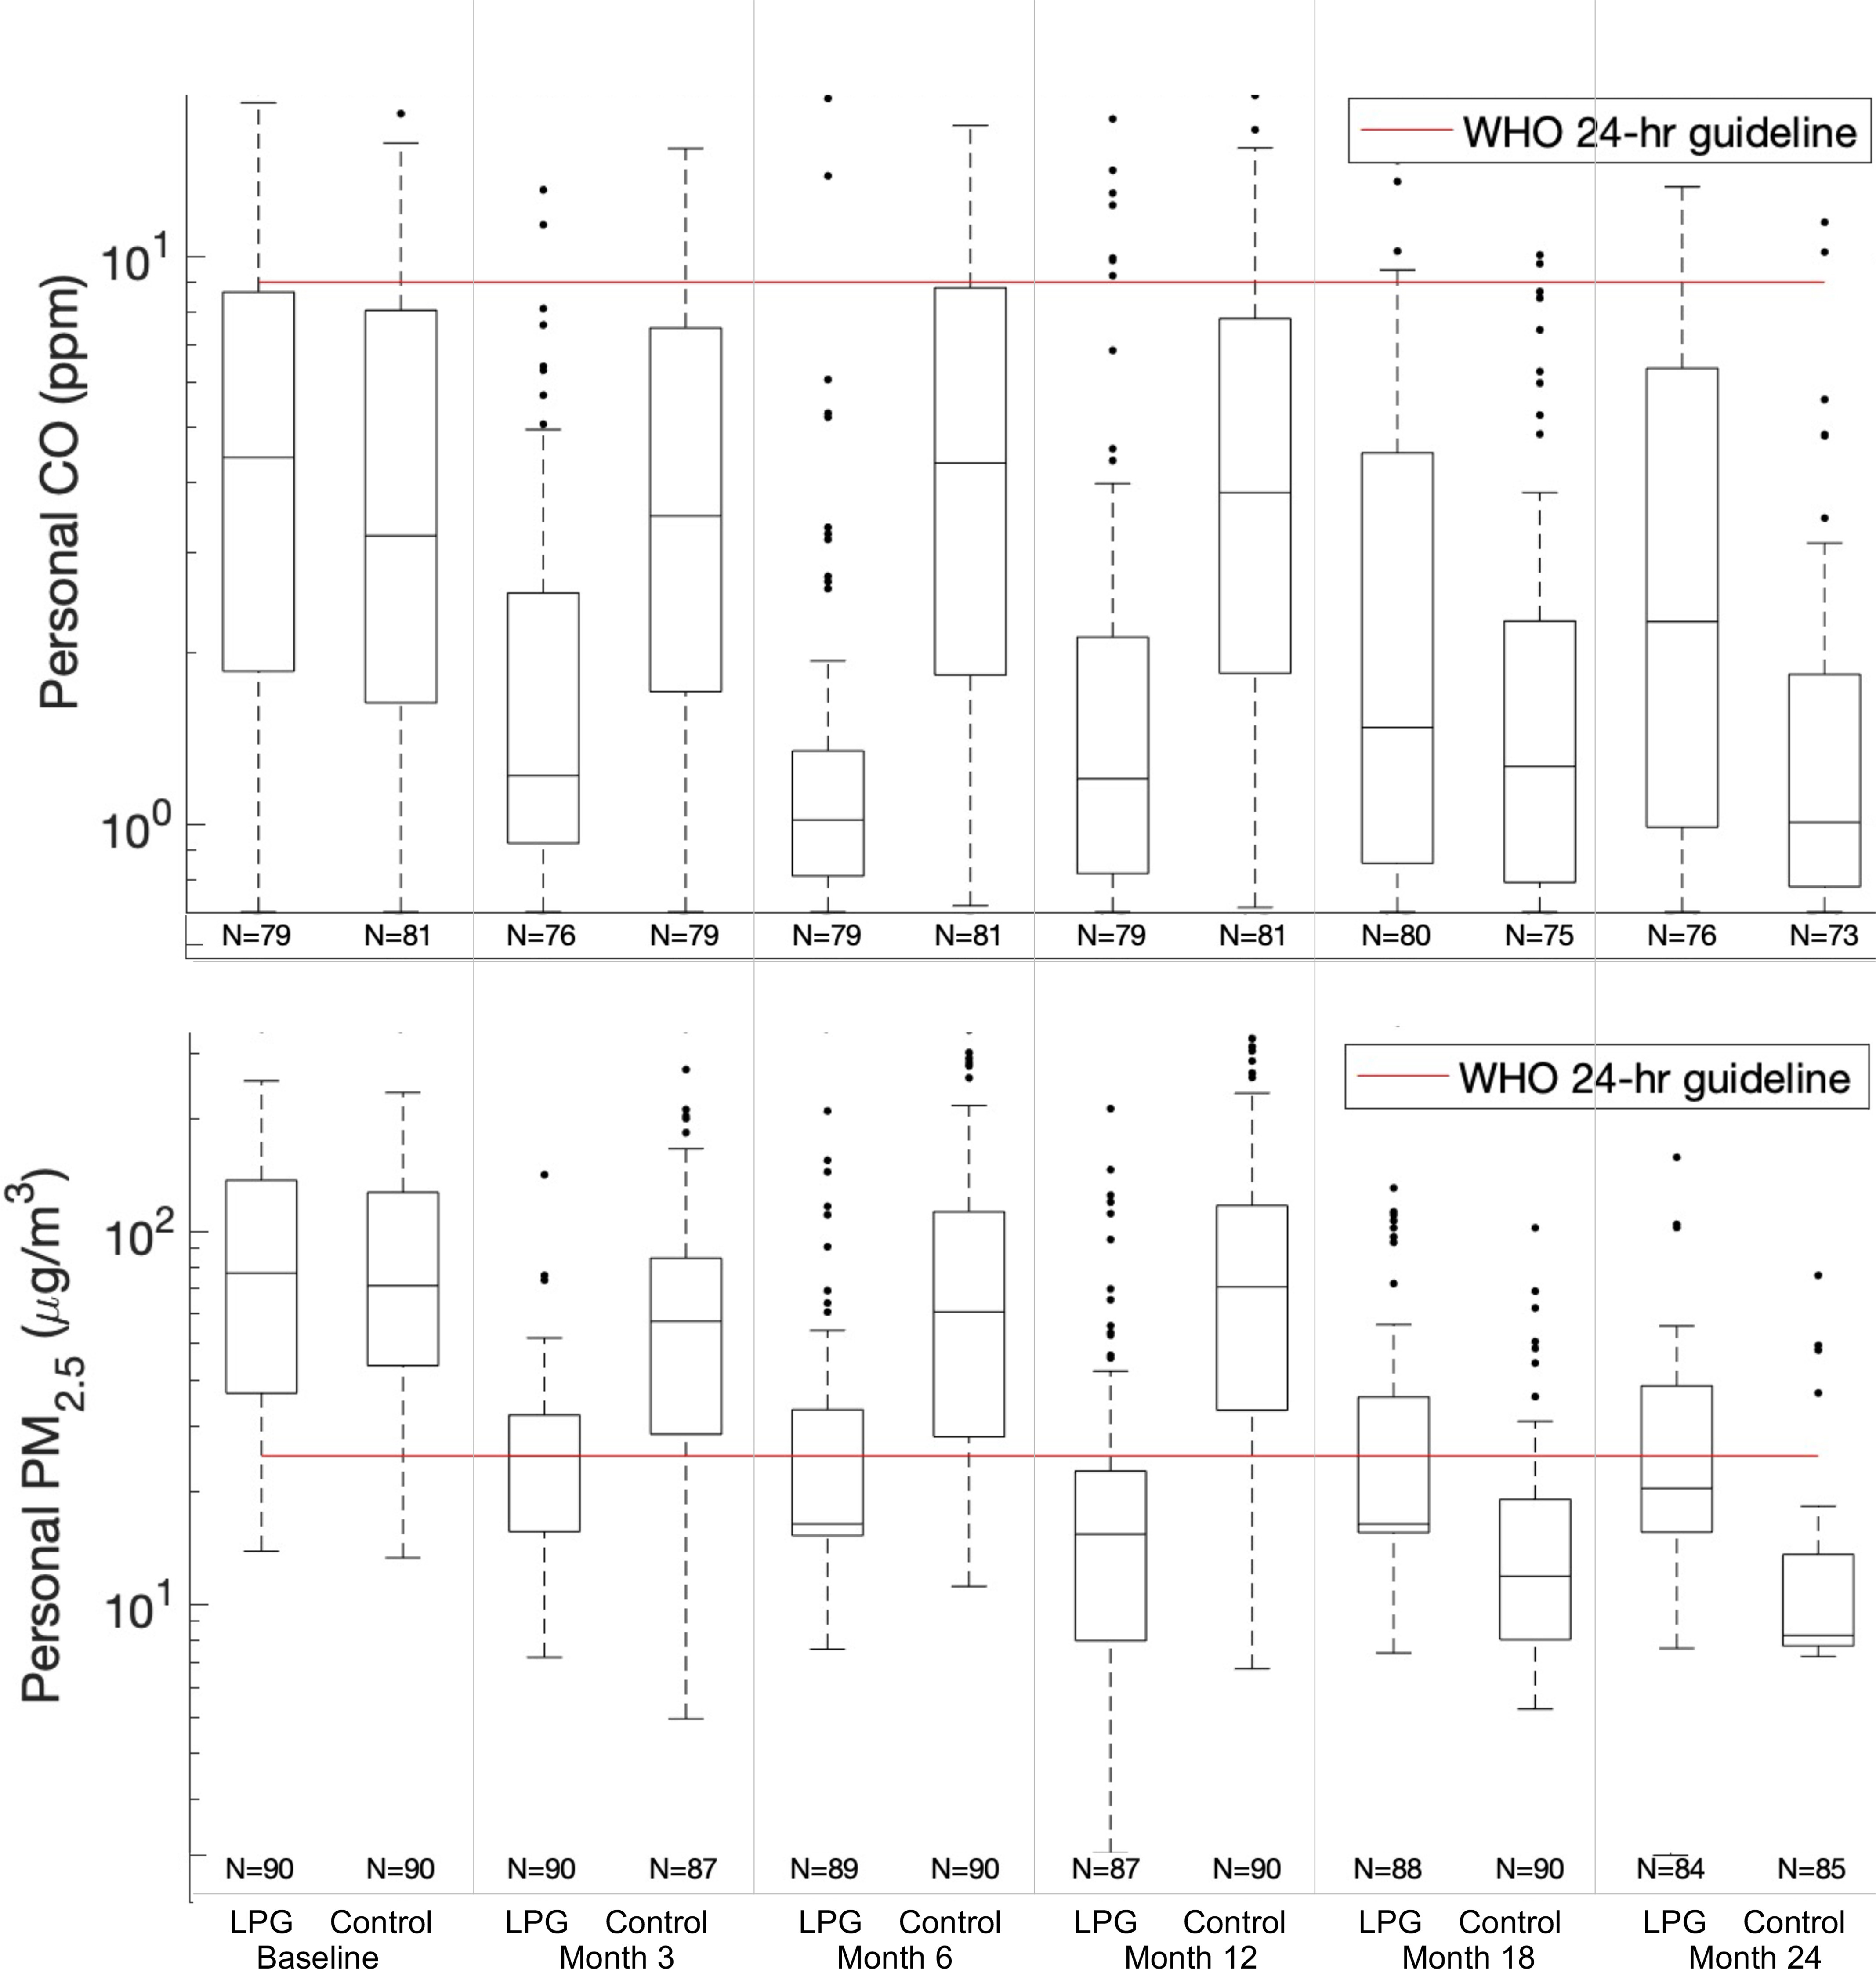
and CO box plots of daily mean personal exposure concentrations at each follow-up visit (baseline, 3-, 6-, 12-, 18-, and 24-months) for LPG stove intervention participants (LPG) and control participants (Control). Daily mean metric used is defined as the mean of the two consecutive 24-h average concentrations, where available. During the second year (follow-up visits:18- and 24 months) the control participants received the LPG stove intervention and vouchers for 1-y supply of free fuel and intervention participants stopped receiving free fuel but kept the LPG stove. Interquartile ranges of the box plots represent the 25th and the 75th percentiles of the daily means for each group; the middle line of the box represents the 50th percentile. Numeric data is provided in Table 2. Note: CO, carbon monoxide; LPG, liquefied petroleum gas; PM, particulate matter; WHO 24-h guideline, World Health Organization daily guideline (PM2.5: 25μg/m3, CO: 9.4 ppm).