. 2022 May 12;130(5):057007. doi: 10.1289/EHP10054

Figure 5.

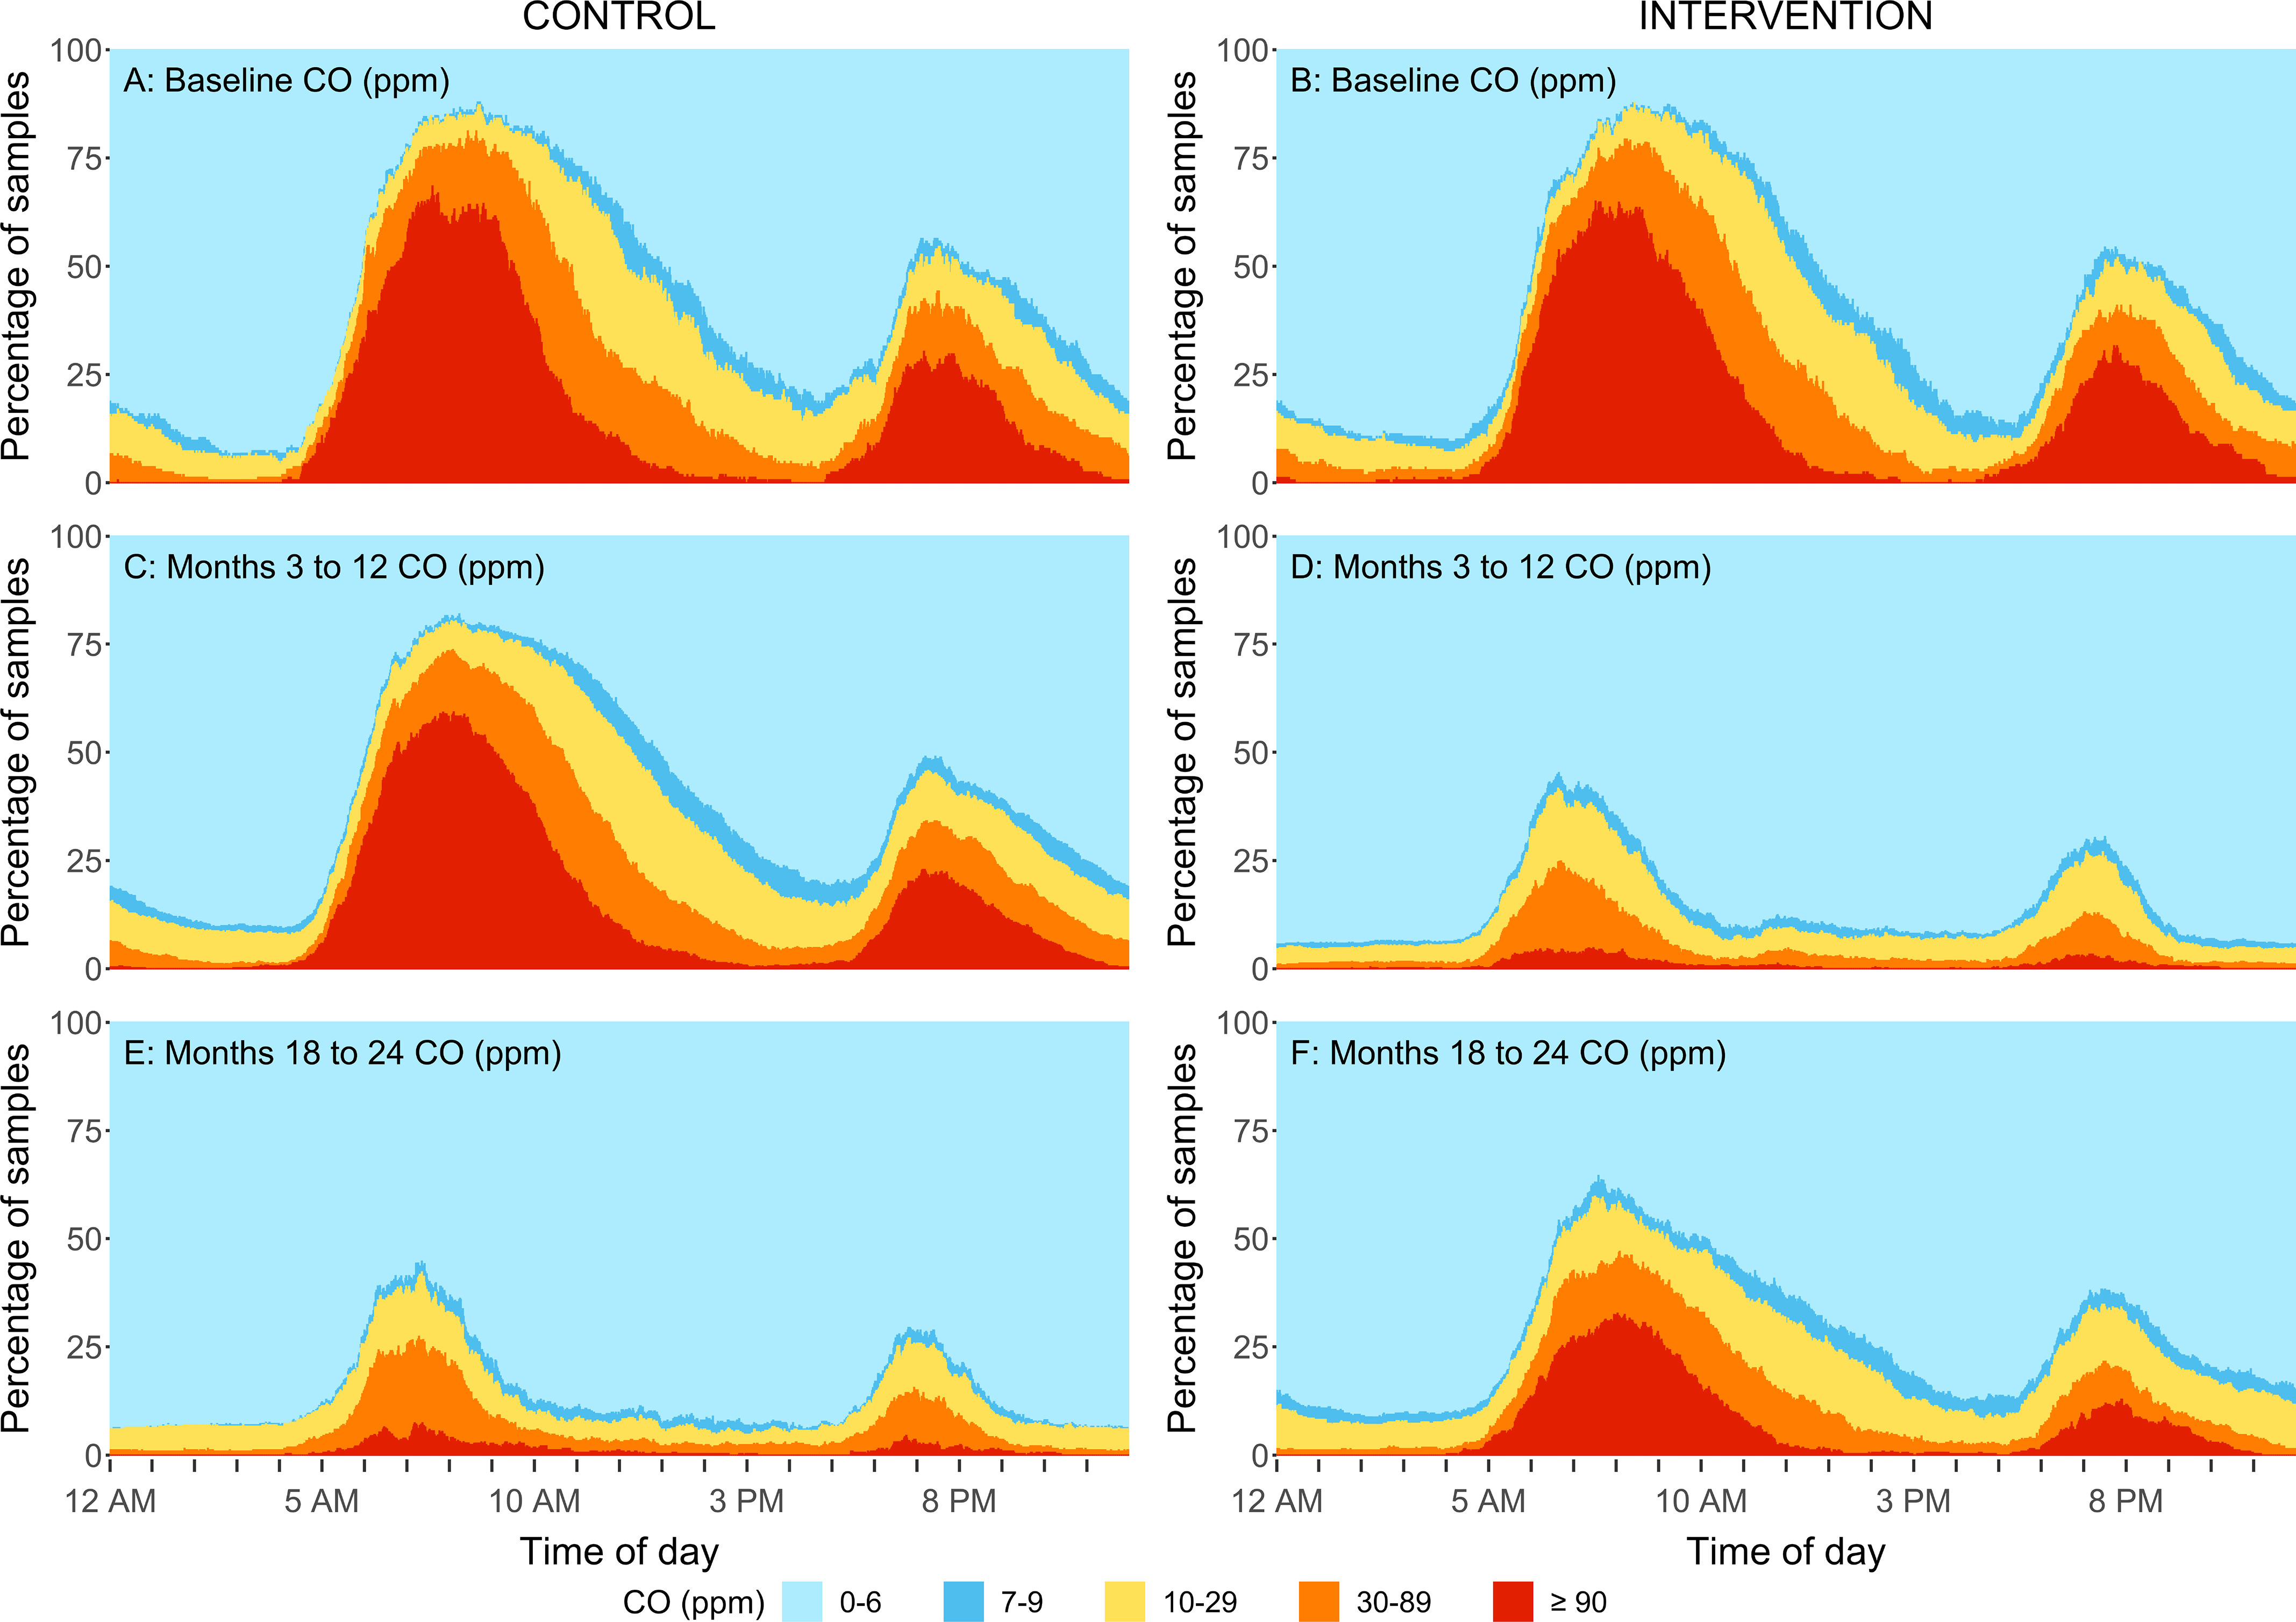
Figure 5 is a set of six area graphs. Figures 5A, 5C, and 5D area graphs titled Baseline Carbon Monoxide (parts per million), Months 3 to 12 Carbon Monoxide (parts per million), and Months 18 to 24 Carbon Monoxide (parts per million) under Control, plotting percentage of samples, ranging from 0 to 100 in increments of 25 (y-axis) across Time of Day, ranging from 12 A M to 8 P M in increments 5 hours (x-axis) for Carbon Monoxide (parts per million), including 0 to 6, 7 to 9, 10 to 29, 30 to 89, and greater than or equal to 90. Figures 5B, 5D, and 5F area graphs titled Baseline Carbon Monoxide (parts per million), Months 3 to 12 Carbon Monoxide (parts per million), and Months 18 to 24 Carbon Monoxide (parts per million) under Intervention, plotting percentage of samples, ranging from 0 to 100 in increments of 25 (y-axis) across Time of Day, ranging from 12 A M to 8 P M in increments 5 hours (x-axis) for Carbon Monoxide (parts per million), including 0 to 6, 7 to 9, 10 to 29, 30 to 89, and greater than or equal to 90.

Percent of kitchen area samples within different CO concentration ranges by minute of a day for the intervention group (B,D,F) and control group (A,C,E) at baseline (A,B), at follow-up samples taken at the 3-, 6-, 12-month time points (C,D) and at 18-, and 24-month time points (E,F) in rural Peru. Samples <LOD were replaced by LOD/2: 0.7 ppm for direct reading CO measurements. The sample size for baseline, 3-, 6-, 12, 18-, and 24-month visits for control and intervention households are: n0=84 and 85, n3=84 and 80, n6=86 and 82, n12=86 and 77, n18=83 and 79, n24=80 and 79. During the second year (follow-up visits:18- and 24 months) the control participants received the LPG stove intervention and vouchers for 1-y supply of free fuel and intervention participants stopped receiving free fuel but kept the LPG stove. Note: CO, carbon monoxide; LOD, limit of detection; LPG, liquefied petroleum gas.