. 2022 May 12;130(5):057007. doi: 10.1289/EHP10054

Figure 6.

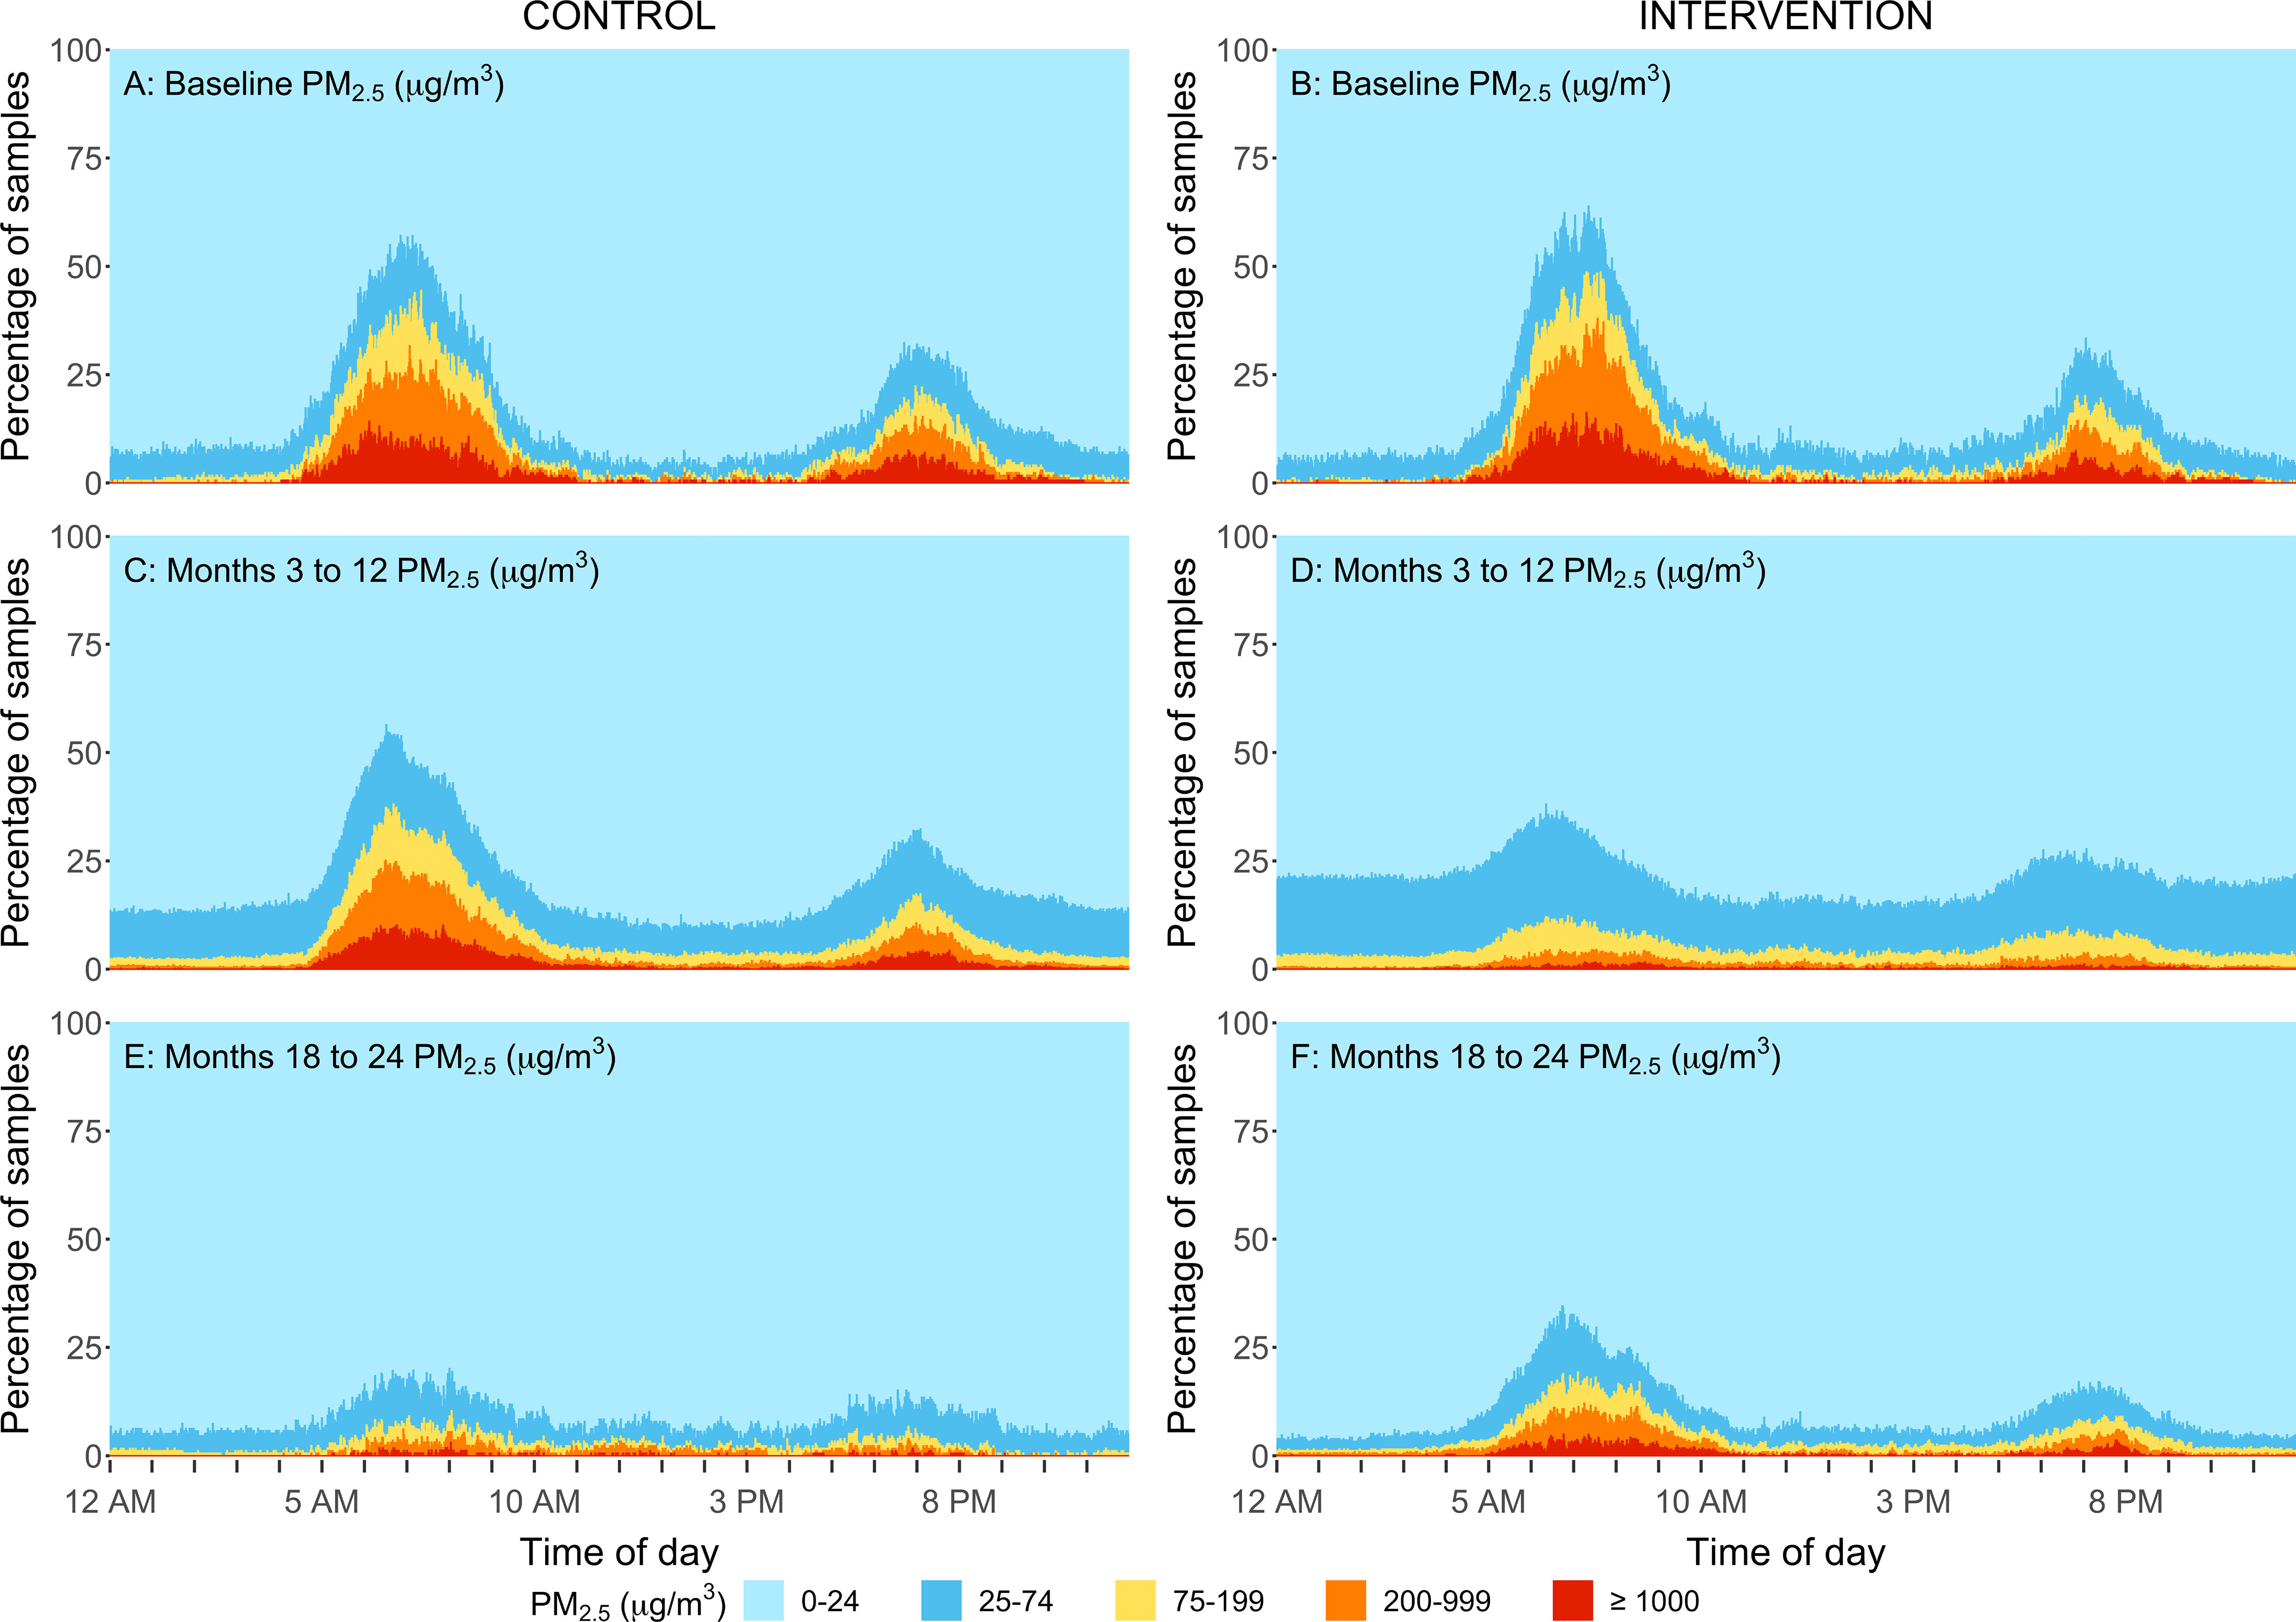
Figure 6 is a set of six area graphs. Figures 6A, 6C, and 6D area graphs titled Baseline particulate matter begin subscript 2.5 end subscript (microgram per meter cubed), Months 3 to 12 particulate matter begin subscript 2.5 end subscript (microgram per meter cubed), and Months 18 to 24 particulate matter begin subscript 2.5 end subscript (microgram per meter cubed) under Control, plotting percentage of samples, ranging from 0 to 100 in increments of 25 (y-axis) across Time of Day, ranging from 12 A M to 8 P M in increments 5 hours (x-axis) for particulate matter begin subscript 2.5 end subscript (microgram per meter cubed), including 0 to 24, 25 to 74, 75 to 199, 200 to 999, and greater than or equal to 1000. Figures 6B, 6D, and 6F area graphs titled Baseline particulate matter begin subscript 2.5 end subscript (microgram per meter cubed), Months 3 to 12 particulate matter begin subscript 2.5 end subscript (microgram per meter cubed), and Months 18 to 24 particulate matter begin subscript 2.5 end subscript (microgram per meter cubed) under Intervention, plotting percentage of samples, ranging from 0 to 100 in increments of 25 (y-axis) across Time of Day, ranging from 12 A M to 8 P M in increments 5 hours (x-axis) for particulate matter begin subscript 2.5 end subscript (microgram per meter cubed), including 0 to 24, 25 to 74, 75 to 199, 200 to 999, and greater than or equal to 1000.

Percent of personal exposure samples within different PM2.5 concentration ranges by minute of a day for the intervention group (B,D,F) and control group (A,C,E) at baseline (A,B), at follow-up samples taken at the 3-, 6-, 12-month time points (C,D) and at 18-, and 24-month time points (E,F) in rural Peru. Samples <LOD were replaced by LOD/27μg for PM2.5 gravimetric integrated samples, respectively. The sample size for baseline, 3-, 6-, 12, 18-, and 24-month visits for control and intervention households are: n0=90 and 90, n3=87 and 90, n6=90 and 89, n12=90 and 87, n18=90 and 88, n24=85 and 84. During the second year (follow-up visits:18- and 24 months) the control participants received the LPG stove intervention and vouchers for 1-y supply of free fuel and intervention participants stopped receiving free fuel but kept the LPG stove. Note: LOD, limit of detection; LPG, liquefied petroleum gas.