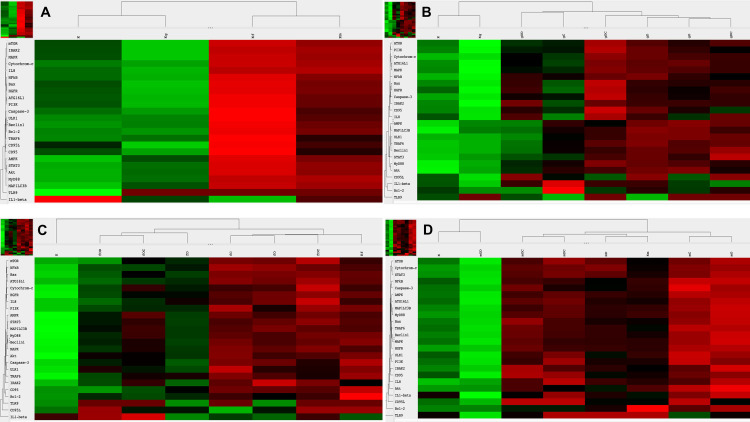
Fig 1. Heatmap visualization of the NanoString gene expression analyses.
A. Gene expression changes of modified DNA treatments as compared to control, non-treated HT29 cells. Gene expression alterations in HT29 cell after incubation with gDNA (B.), fDNA (C.), and mDNA (D.). g/f/mDNA: genomic / fragmented / hypermethylated deoxyribonucleic acid; O: ODN2088 –TLR9 inhibitor; D: 4,4’Diisothiocyanatostilbene-2,2’-disulfonic acid; C: chloroquine; K: control, non-treated HT29 cells; Kg/f/m: g/f/mDNA treated control HT29 cells; red: overexpression, green: down-regulation.

