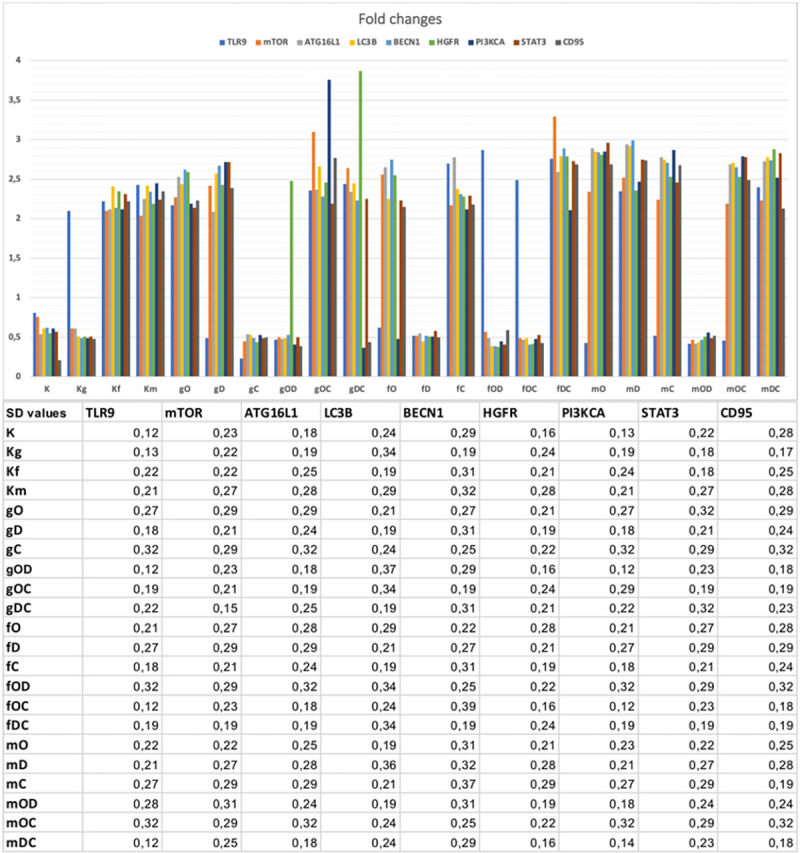
Fig 3. Graphical visualization of the Taqman fold changes.

The table displays the related standard deviation results (SD). All SD values were under 0.5 cycle. K: control, non-treated HT29 cells; g/f/mDNA: genomic / fragmented / hypermethylated DNA; O: ODN2088; D: DISU; C: chloroquine.
