
Fig 5. Results of the p62/sequestrome 1 and LC3B WES Simple Western blot.
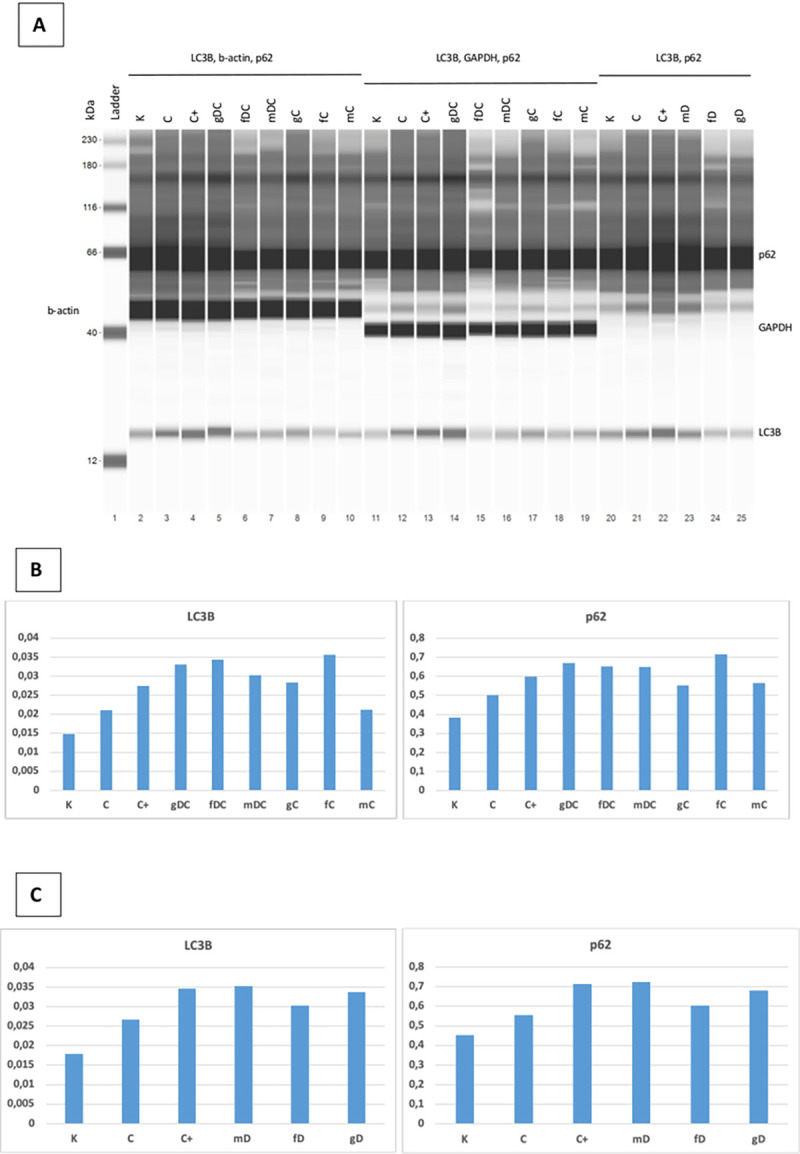
A. Representative blot images. B and C. Graphical representation of the protein expressions: the area of the tested proteins was multiplied by the values of the β-actin area. K: control, non-treated HT29 cells; C: chloroquine (10 μM); C+: chloroquine (50 μM); g: genomic DNA; f: fragmented DNA; m: hypermethylated DNA; D: DISU; C: chloroquine (10 μM).