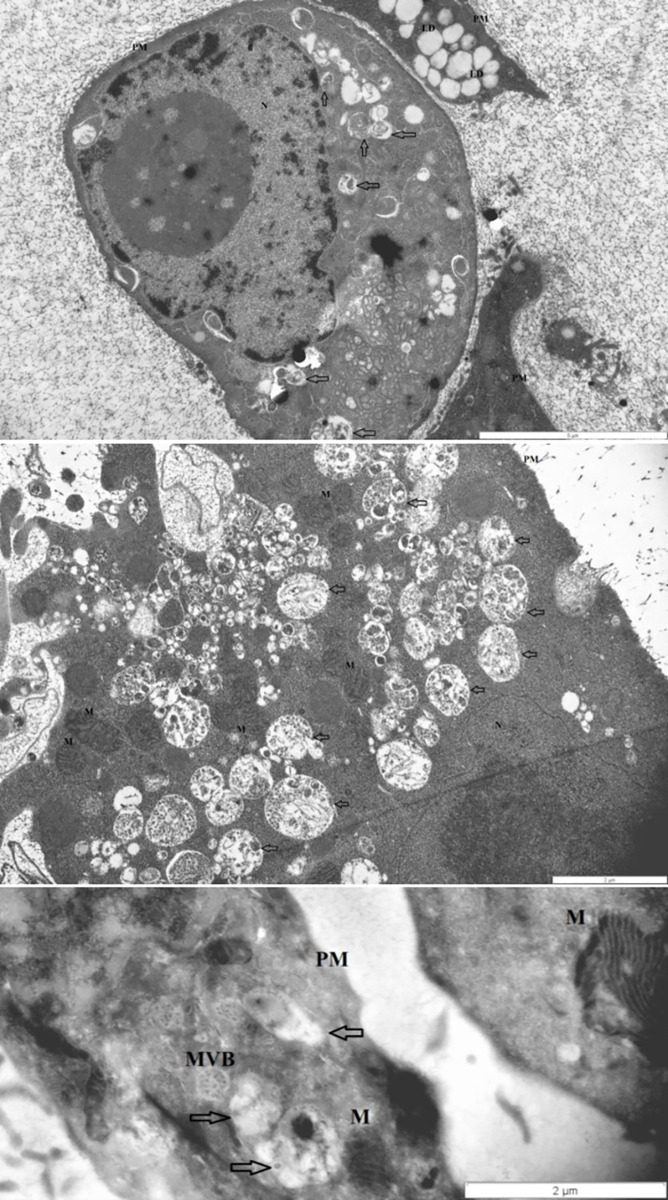
Fig 6. Transmission electron microscopy results.
The representative images highlight the autophagy-related structural changes in HT29 cells (from top to down: disorganized nucleus with chromatin condensation plus autophagic vacuoles; single and aggregated autophagic vacuoles; multivesicular body). Arrows: autophagic vacuoles; MVB: multivesicular body; PM: plasma membrane; N: nucleus; M: mitochondrium; L: lipid droplet.

