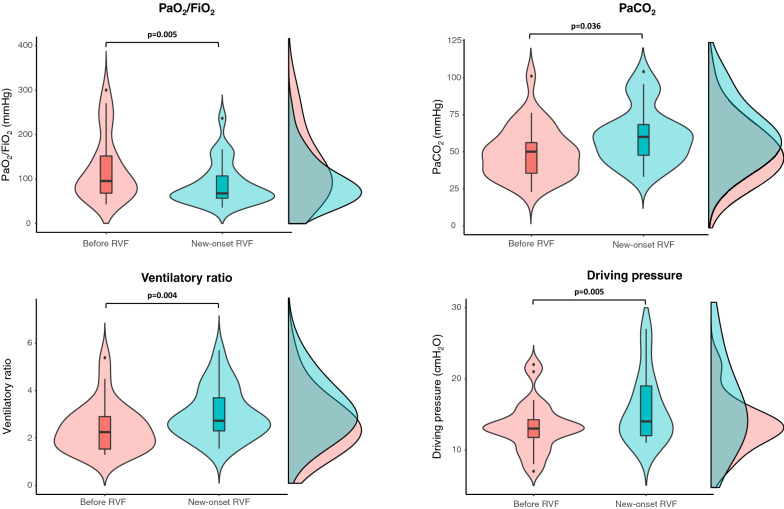
Fig. 1.
Variation of respiratory parameters between the day of diagnosis of new-onset RVF and the previous echocardiography assessment. Violin plots, box plots and densities for each measured parameter are displayed. Within the box plots, the bold black line indicates the sample median, the hinges indicate 25th and 75th quantiles, and the whiskers point to 1.5 interquartile ranges beyond the hinges. Paired tests with Wilcoxon signed-rank test were used. Median PaO2/FiO2 (70 [57–126] vs. 96 [69–159] mmHg: p = 0.005), PaCO2 (60 [46–65] vs. 51 [35–61] mmHg: p = 0.036), ventilatory ratio (2.73 [2.29–3.57] vs. 2.25 [1.51–2.92]: p = 0.004) and driving pressure (14 [13–19] vs. 13 [10–14] cmH2O: p = 0.005) significantly worsened between RVF diagnosis and preceding echocardiography assessment. Abbreviations: RVF right ventricle failure

