
Figure 2. Waterfall Plot of Phase I and Phase II Patients.
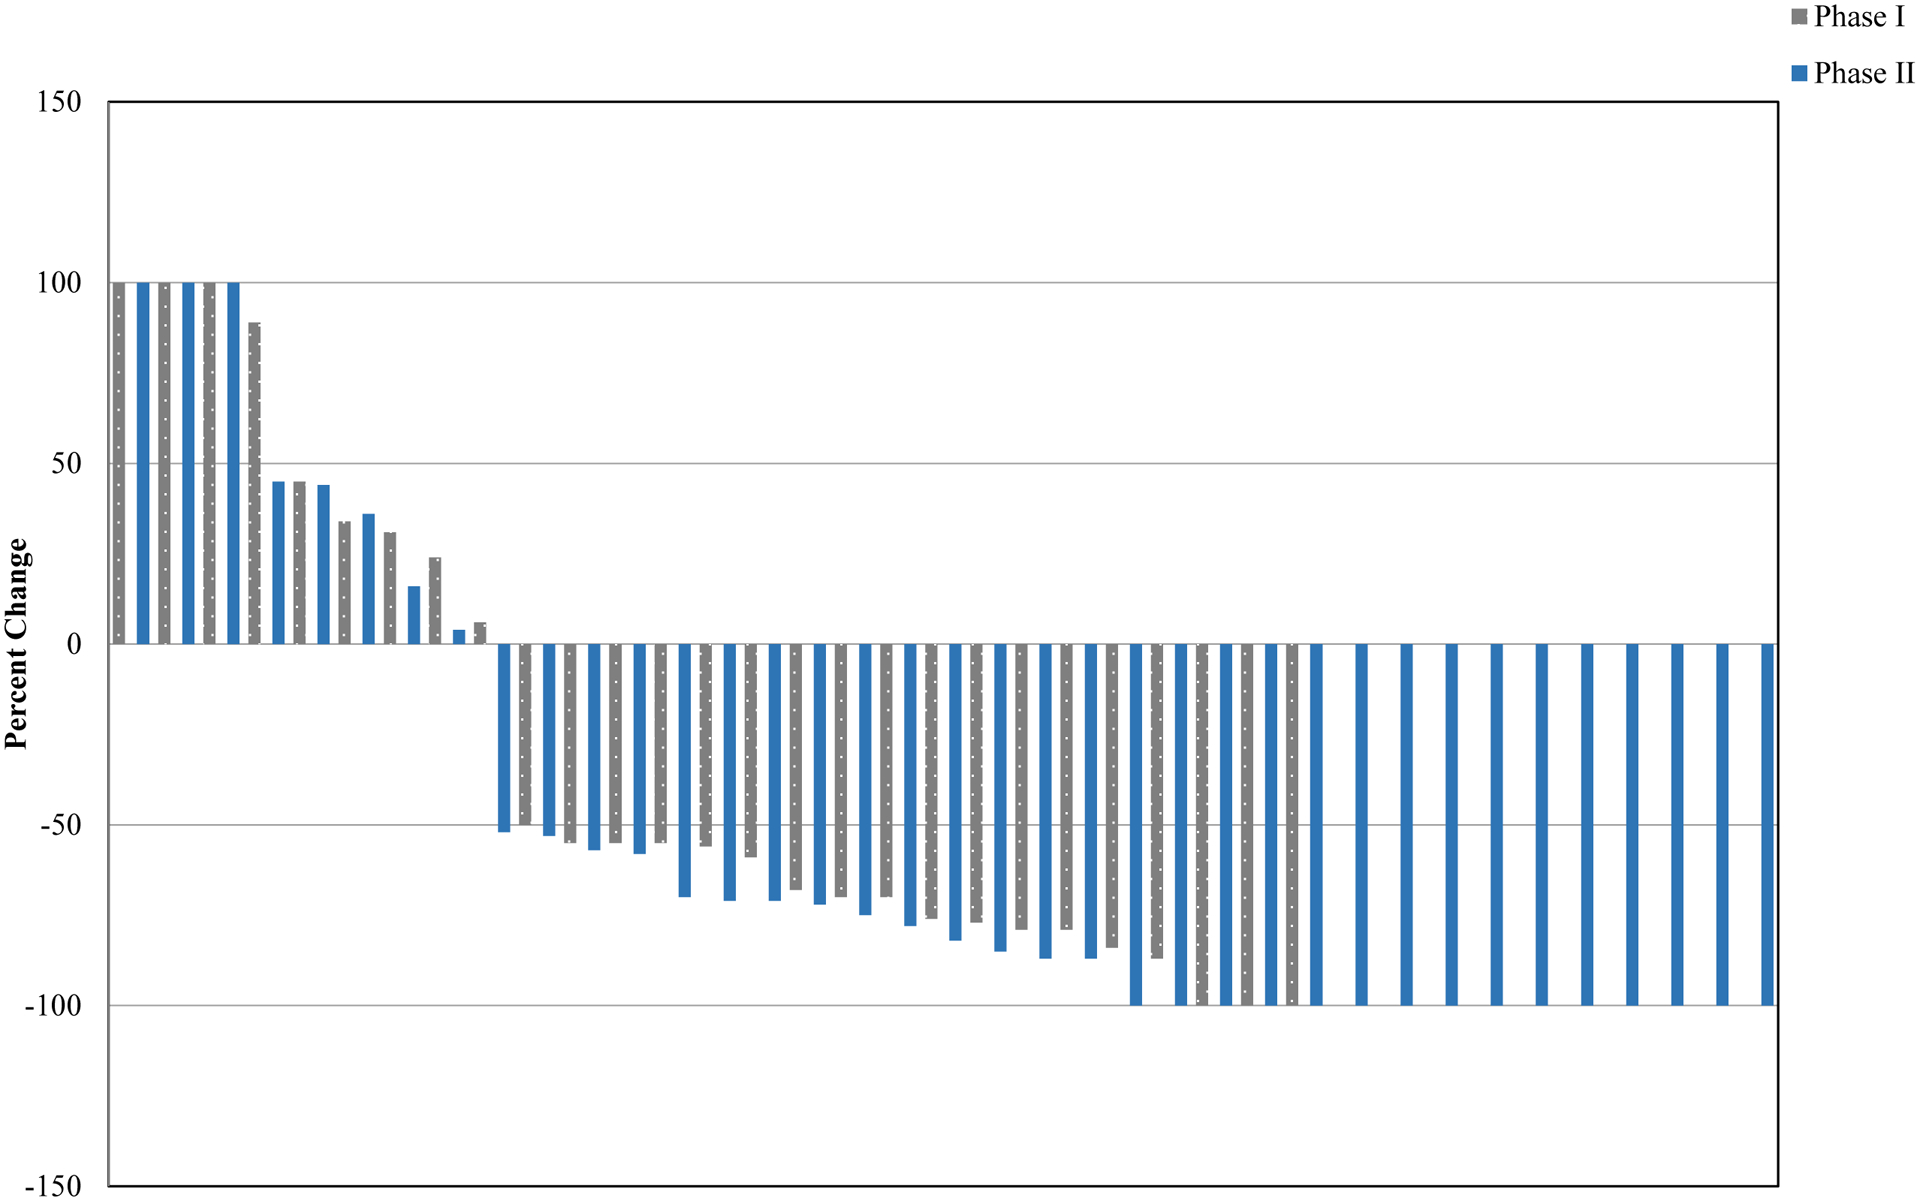
Waterfall plot depicting responses for patients in the Phase 1 and Phase 2. Changes in tumor baseline are shown, with all complete remissions being defined by functional imaging as PET negative.