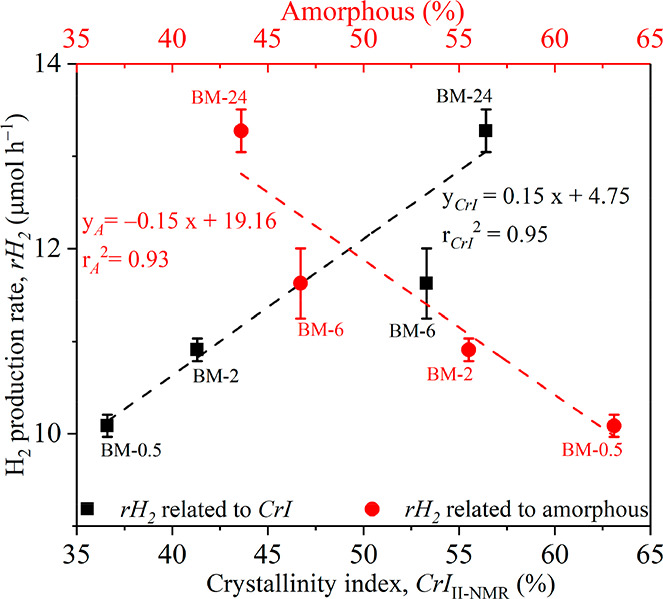
Figure 4.

Correlations of rH2 with the crystallinity index of cellulose II (CrIII-NMR, bottom x axis) and the amorphous composition (top x axis) calculated from the C4 region of the recrystallized BM-treated MCCs. Red symbols, correlation of amorphous composition and rH2; black symbols, correlation of CrIII-NMR and rH2.
