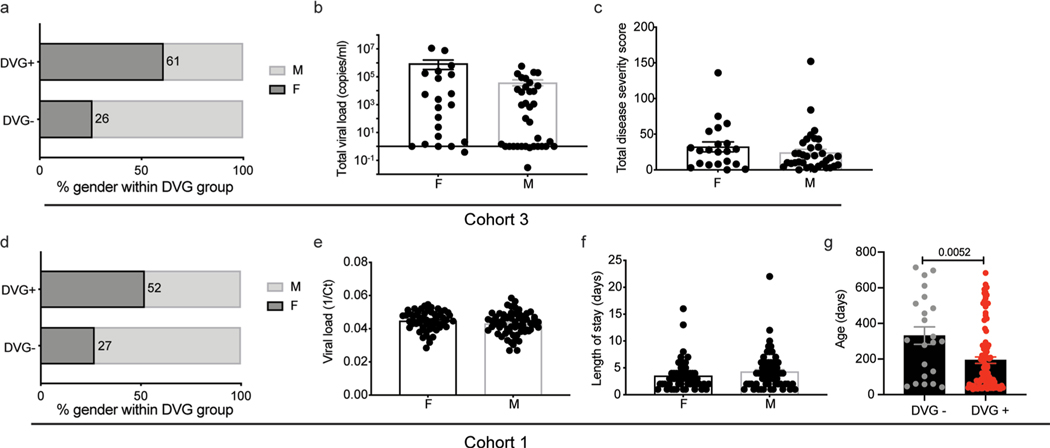
Extended Data Fig. 6 |. impact of sex and age on cbDVg generation in different cohorts.
In Cohort 3, a, the percentage of female and male patients within the cbDVG+ (11:7 ratio) and cbDVG- (10:28 ratio) groups were compared with the percentage of female subjects shown within the bars. (b-c) showing the comparison of viral load (b) and disease severity (c) between females (n=21) and males (n=35). Data are shown as mean±s.e.m. In Cohort 1, (d) the percentage of female and male patients within the cbDVG+ (52:48 ratio) and cbDVG- (6:16) groups were compared with the percentage of female subjects shown within the bars. (e-f) showing the comparison of viral load (e) and length of stay (f) between females (n=56, n=58) and males (n=62, n=64). Data are shown as mean±s.e.m. g, Age was compared between cbDVG+ (n=100) and cbDVG- (n=22) patients. Data are shown as mean±s.e.m. Significance upon Mann-Whitney test.

