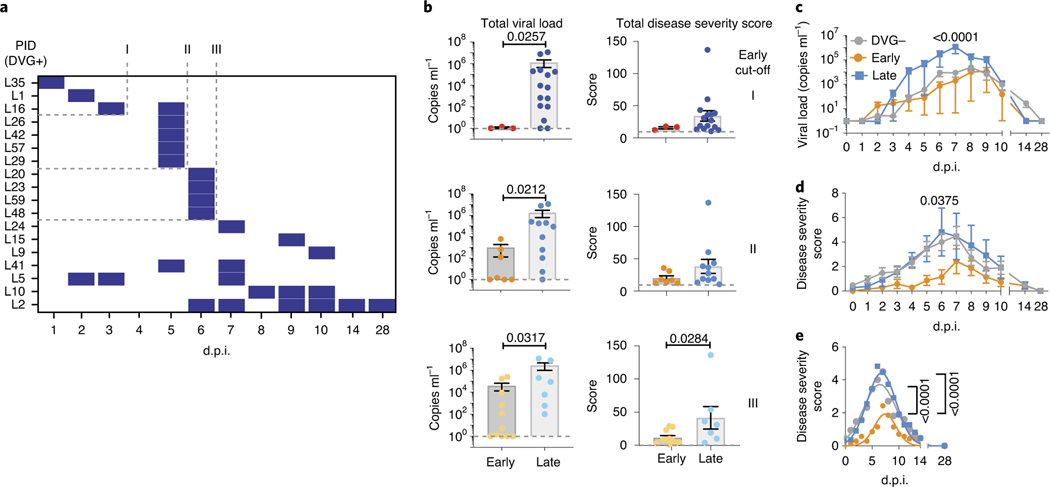
Fig. 5 |. Early appearance of cbDVgs associates with lower viral loads and disease severity scores in experimentally infected subjects.
a, Criteria for early cbDVG appearance and clearance. The heatmap indicates the time points when cbDVGs were detected in samples from 18 cbDVG+ volunteers. Coded patient IDs (PID) are indicated on the left. Three cut-offs used to define cbDVGs as ‘Early’ are indicated: first detection within 3 d.p.i. (I), 5 d.p.i. (II) and 6 d.p.i. (III). For all three cut-offs, DVGs had to be cleared within the first 6 days of infection to be considered ‘Early’. All other patients were considered ‘Late’ cbDVG producers. b, Comparison of total viral load (left) and disease severity score (right) between Early and Late groups for all three cut-offs. For Early groups n = 3 (cut-off I), n = 7 (cut-off II) and n = 11 (cut-off III) and Late groups n = 15 (cut-off I), n = 11 (cut-off II) and n = 7 (cut-off III). Each dot represents the total score or viral load from individual participants and data are shown as mean ± s.e.m. Significant P values for two-tailed Mann–Whitney test are indicated. c,d, Cut-off II was selected to show the comparison of the kinetics of (c) viral load and (d) disease severity score among negative (n = 38), Early (n = 7) and Late (n = 11) groups. Data are plotted over time and trendline represents mean ± s.e.m. Significant P values for two-way analysis of variance (ANOVA) with Bonferroni post-hoc test for Early versus Late groups are indicated. e, Best-fit curves for kinetics of disease severity scores from negative (n = 38), Early (n = 7) and Late (n = 11) groups were calculated using a nonlinear Gaussian model. The best-fit values for amplitude of the negative, Early and Late group curves were compared.

