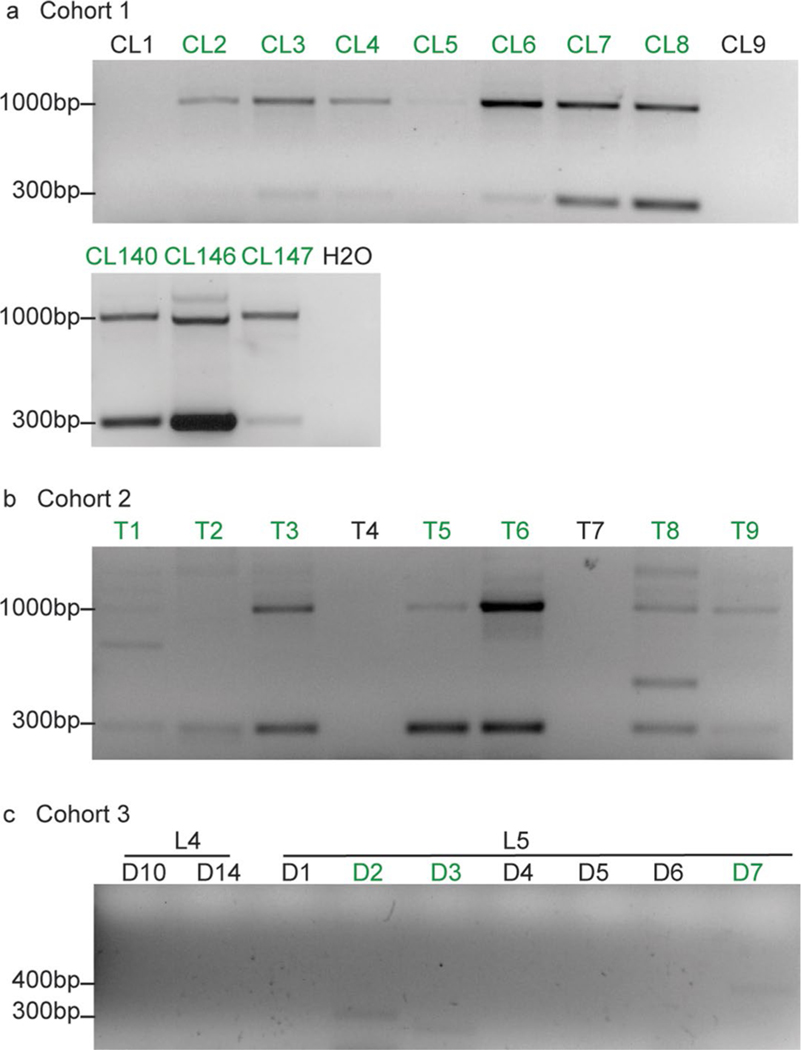
Extended Data Fig. 2 |. representative DNA gel pictures of Cohorts 1, 2 and 3.
Positive PCR results were marked in green. H2O was added as a negative control for each PCR as shown in (a). a, same results were observed for all samples for two independent repeats. b, same results were observed for most samples for 4 independent repeats. T1, T2, T4 and T7 were positive 2, 3, 1 and 1 time out of 4 total repeats, respectively. c, same results were observed for most samples for two independent repeats. D3 and D7 were positive 1 time out of 4 total repeats.

