. 2022 Apr 25;11:e75690. doi: 10.7554/eLife.75690

Figure 5. Trade-off between airineme directional sensing information and the probability of contacting the target cell.

(A) Given that the source cell is located at θ=0, the distribution of angles at which the airineme contacts the target cell. (B) Given a source cell is located at θ=0, the distribution of angles at which the airineme contacts the target cell. Angle distributions with higher variance indicate poorer directional sensing. Three angular diffusion values (near ballistic limit, experimentally observed, and near diffusion limit) are shown. (C) Directional sensing accuracy, quantified using the modified Fisher information (FI) Equation 9, for different source-to-target distances and different ranges of angular diffusion values are tested, while fixing target cell radius at 25 µm. Black rectangular region shows the FI values for the observed airineme curvature. (D) Relationship between the contact probability Pcontact and FI for a range of Dθ (increasing with direction of arrow).

Figure 5.

Figure 5—figure supplement 1. Experimental measurement of contact angle and directional information.

Figure 5—figure supplement 1.

(A) Representative image of source cell (green), airineme (light green, touching two white lines), and target cell (purple). To estimate the contact angle distribution, we draw a line from the source of the airineme to the center of the nucleus of the target cell, then another line from here to the airineme contact point. Scale bar is 50 μm. (B) The angle distribution of contact angles shown in an angular histogram (top) and empirical cumulative distribution (bottom). From these, compute (unmodified) Fisher information (FI) of 3.93×10⁻⁴rad-2, and modified FI to be 5.7×10⁻⁵rad-2 from Equation 9. Data from N=83 airinemes.
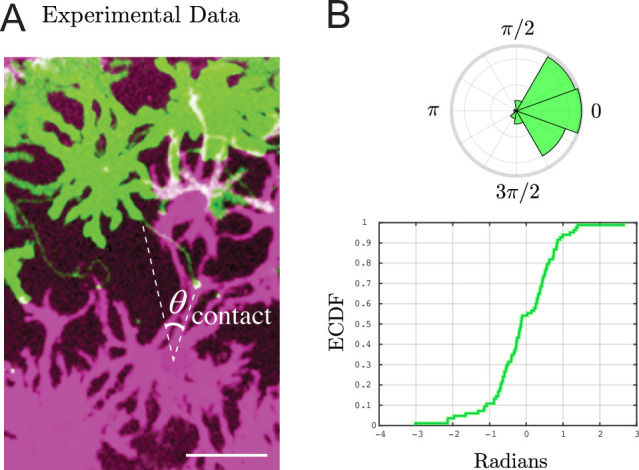
Figure 5—figure supplement 2. Trade-off between directional sensing and contact probability for range of parameters.

Figure 5—figure supplement 2.

Each plot shows, identically to Figure 5D, the contact probability Pcontact (vertical axis) versus the directional information (modified Fisher information defined in Equation 9) for a range of angular diffusion coefficients Dθ indicated by color along a parametric curve. The grid of plots shows this for a range of distances to the target dtarg and target sizes rtarg. Note that although we do not explicitly explore lmax, since these plots have not been nondimensionalized, the parametric curve for a different lmax can be obtained by rescaling the results shown.