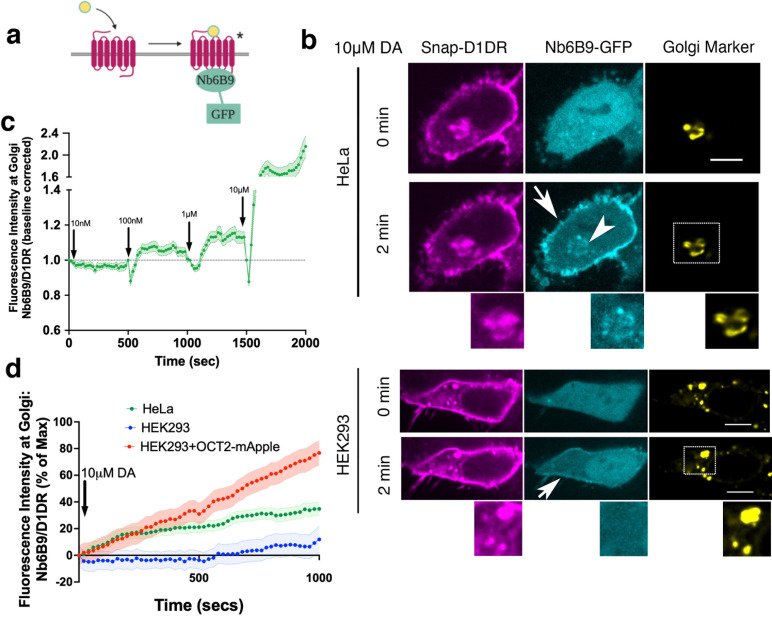
Figure 1. Conformational biosensor detects activated D1DR at the plasma membrane and the Golgi upon dopamine (DA) stimulation.
(a) Nb6B9 binds to the receptor exclusively in its active conformation. We fused Nb6B9 to GFP and used it as a conformational biosensor for D1DR. (b) Confocal images of representative D1DR-expressing HeLa (top panel) and HEK293 cells (lower panel) with Nb6B9-GFP and GalT-mRFP expression before and after 10 µM DA addition. Stimulation with 10 µM DA results in recruitment of Nb6B9 to active D1DR at the plasma membrane and the Golgi in HeLa cells (n = 37 cells, Pearson’s coefficient = 0.62, respectively, nine biological replicates); 10 µM DA treatment only activates plasma membrane-localized D1DR in HEK293 cells (n = 17 cells, Pearson’s coefficient = 0.15, five biological replicates). Lower panels show zoomed images of insets for Snap-D1DR, Nb6BP, and the Golgi marker. Arrows indicate active D1DR at plasma membrane; arrowhead indicates active D1DR at Golgi membrane; Scale bar = 10 µm. (c) Quantification of D1DR activation at the Golgi in HeLa cells upon addition of increasing concentrations of DA; normalized fluorescence intensity of Nb6B9 at Golgi relative to Snap-tagged-D1DR at Golgi. Quantifications were baseline corrected after addition of each dose (n = 27 cells, four biological replicates). (d) Quantification of D1DR activity at Golgi in HeLa and HEK293 cells; normalized fluorescence intensity of Nb6B9 at Golgi relative to D1DR at Golgi labeled with Snap-tagged-D1DR.

