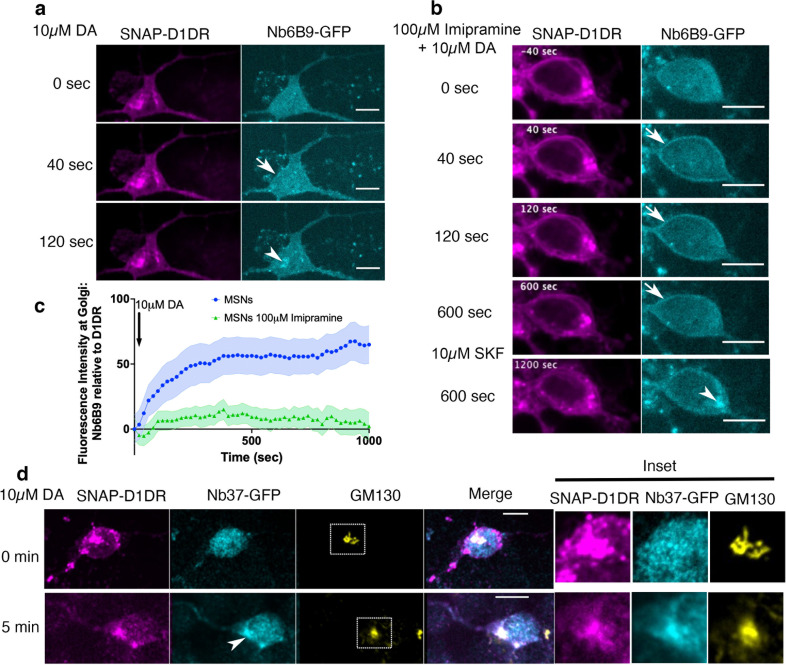
Figure 3. Regulation of dopamine (DA)-mediated activation of the Golgi-localized D1DR in striatal neurons by OCT2.
(a) Representative medium spiny neurons (MSN) expressing Snap-D1DR and Nb6B9-GFP at indicated times after 10 µM DA addition. DA stimulates D1DR activation at the Golgi in MSNs (n = 22 cells, Pearson’s coefficient = 0.67, six biological replicates). Arrow indicates active D1DR at plasma membrane; Arrowhead indicates active D1DR at Golgi membrane; Scale bar = 10 µm. (b) Representative MSN cell expressing Snap-D1DR and Nb6B9-GFP, pretreated with 100 μM imipramine for 15 min, before and after 10 µM DA addition. Inhibition of OCT2 blocks Golgi-localized D1DR activation at MSN n = 18 cells, Pearson’s coefficient = 0.38, six biological replicates but SKF81297 can still reach the Golgi membranes and activate D1DR Golgi pool (n = 6 cells, Pearson’s coefficient = 0.75, four biological replicates). Arrow indicates active D1DR at plasma membrane; Arrowhead indicates active D1DR at Golgi membrane; scale bar = 10 μm. (c) Quantification of Nb6B9-GFP recruitment at Golgi upon 10 μM DA stimulation in MSNs cells pretreated with OCT2 inhibitor; normalized fluorescence intensity of Nb6B9-GFP relative to Snap D1DR at Golgi (n = 12 and 7, respectively, five biological replicates). (d) Representative MSN expressing Snap-D1DR and Nb37-GFP before and after 10 µM DA addition. DA stimulates G protein activation at the Golgi in D1DR-expressing MSNs (n = 10 cells, Pearson’s coefficient = 0.34 and 0.62 before and after 10 µM DA stimulation, six biological replicates). Arrowhead indicates active Gs at Golgi membrane; right panels show zoomed images of insets for Snap-D1DR, Nb37-GFP, and the Golgi marker (GM130). Scale bar = 10 μm.


