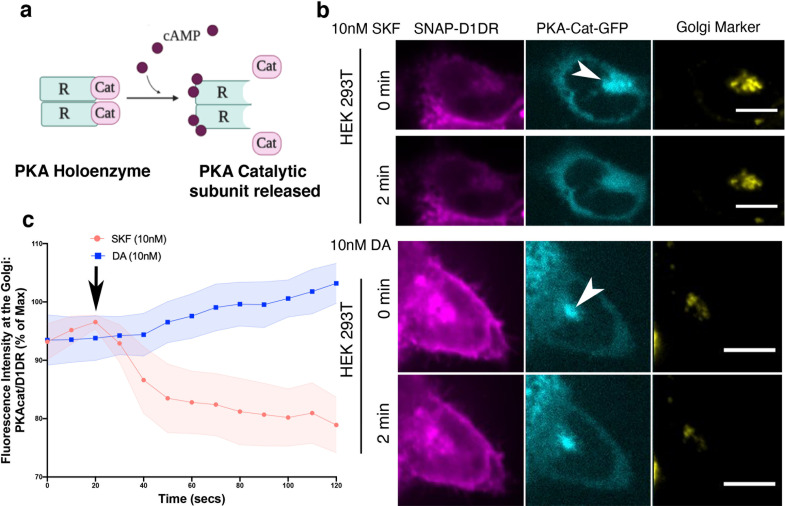
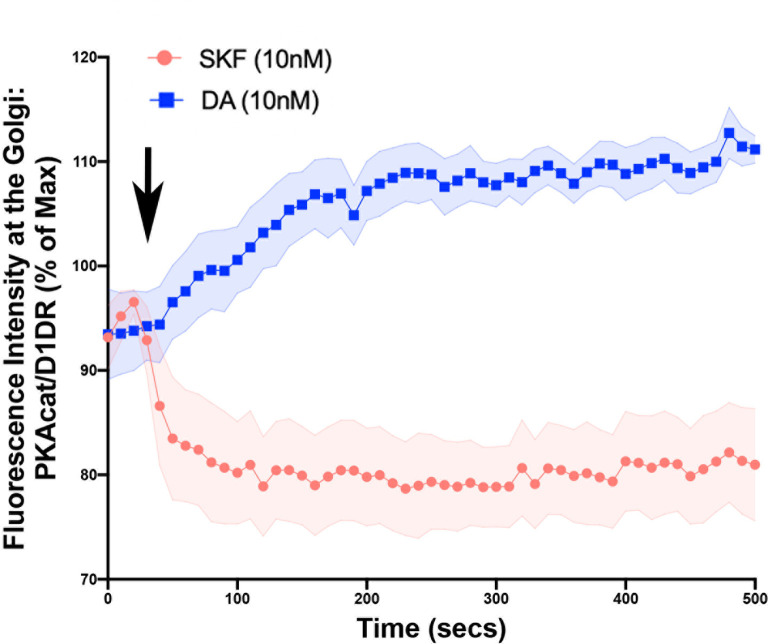
Figure 5. Golgi-localized protein kinase A (PKA) is activated by D1DR at the Golgi.
(a) Model of PKA activation; cAMP binds PKA regulatory subunit (R), rendering PKA catalytic subunit (PKA-cat) dissociation. (b) Confocal images of representative D1DR-expressing HEK293 cells with endogenous PKA-cat-GFP and GalT-mRFP expression at indicated times after 10 nM SKF81927 (top panels; n = 11 cells, Pearson’s coefficient 0.53, three biological replicates) or 10 nM dopamine (DA) (lower panels, n = 12 cells, Pearson’s coefficient = 0.64, three biological replicates). Arrowhead indicates PKAcat at Golgi membrane; scale bar = 10 µm. (c) Normalized fluorescence intensity of PKAcat relative to Golgi-D1DR after treatment with 10 nM DA or 10 nM SKF81927.


