FIGURE.

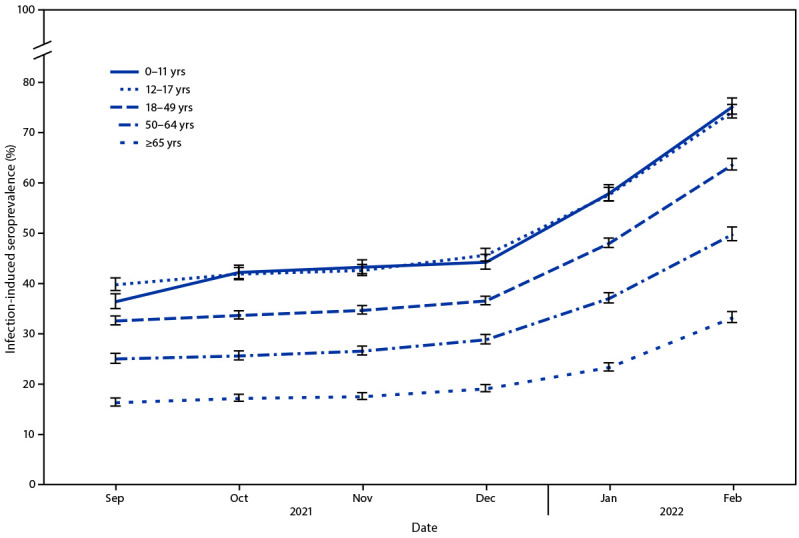
Seroprevalence of infection-induced SARS-CoV-2 antibodies,* by age group — United States, September 2021–February 2022
* Error bars represent 95% CIs at each time point.

Seroprevalence of infection-induced SARS-CoV-2 antibodies,* by age group — United States, September 2021–February 2022
* Error bars represent 95% CIs at each time point.