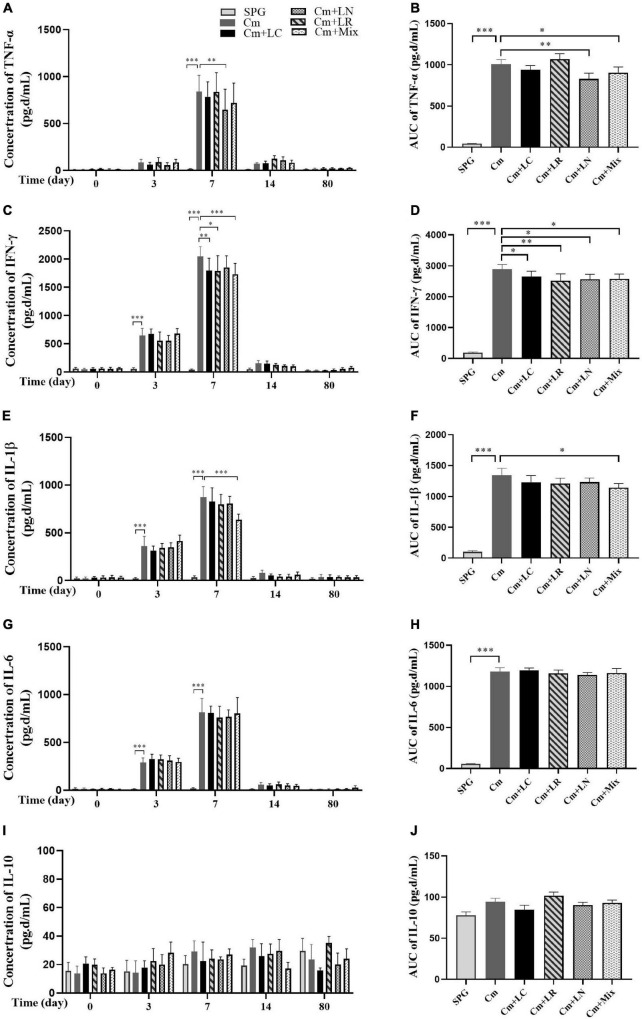
FIGURE 4.
Monitoring early cytokine production kinetics from mouse genital tract after genital chlamydia infection. Vaginal swabs were taken at different time points postinoculation (Days 0, 3, 7, 14, and 80) as indicated along the x-axis. The levels of TNF-α (A), IFN-γ (C), IL-1β (E), IL-6 (G), and IL-10 (I) in the genital tract of mice were measured and expressed as pg/ml along the y-axis, with the corresponding area under the curve of which calculated on the right side (B,D,F,H,J). Results from an independent sample. *p < 0.05, **p < 0.01, and ***p < 0.001 vs. the Cm group (one-way ANOVA).

