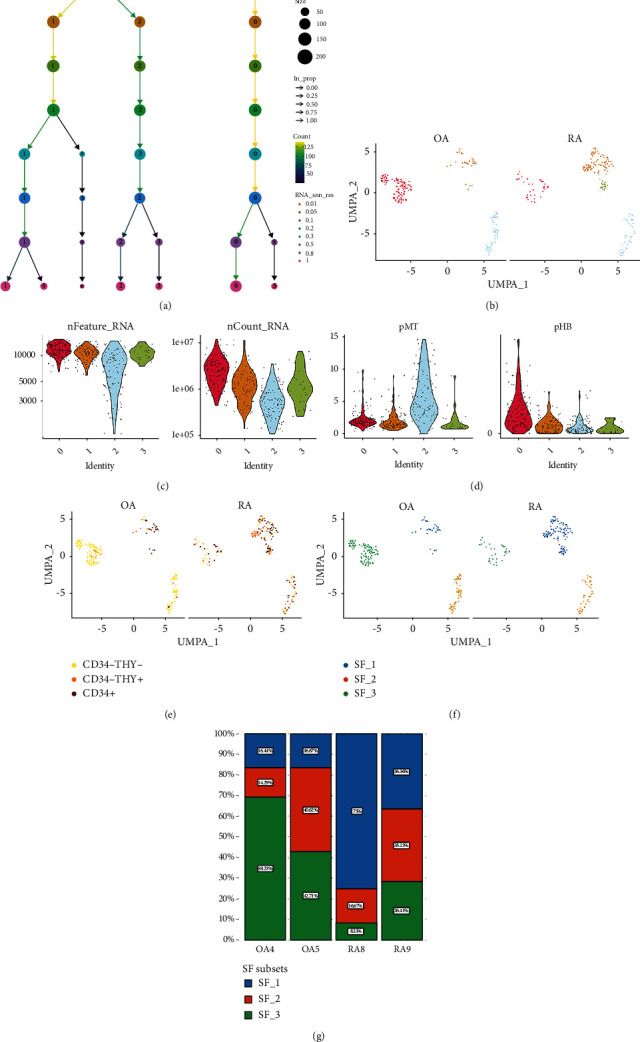
Figure 2.

Clustering of single-cell transcriptome data. (a) Dynamic clustering tree showing the process of clustering of cell clusters as the resolution changes. (b) UMAP illustrates the comparison of the distribution of cell clusters between OA and RO. (c–d) Quality control of single-cell transcriptome data in four cell clusters after clustering. (e) UMAP shows the comparison between OA and RA groups for SF subgroups from the original study. (f) UMAP displays the distribution of the three SF subsets between the two groups. (g) Bar chart showing the percentage of three SF subsets in each of the four samples.
