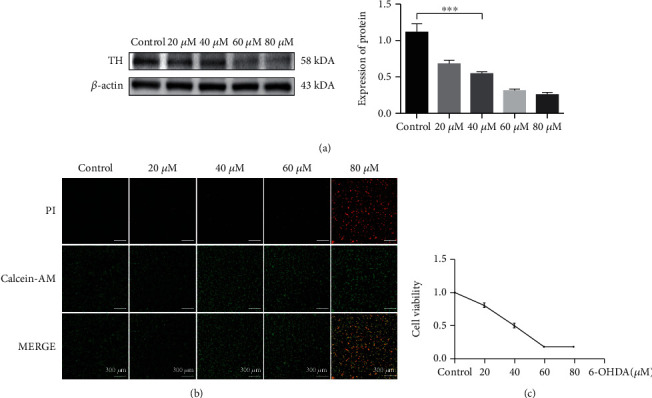
Figure 3.

Screening the optimal stimulation concentration of the 6-OHDA to establish the PD cell model. (a) Stimulation of PC-12 cells with 20, 40, 60, and 80 μM concentration of 6-OHDA for 24 hours. The expression of TH was detected by Western blotting. (b) PC-12 cells were treated with 20, 40, 60, 80 μM concentration of 6-OHDA for 24 hours, and live and dead cells were detected by immunofluorescence, live cells by red PI, and dead cells by green calcein-AM. Observation of cellular changes with fluorescence microscopy. (c) PC-12 cells were treated with 20, 40, 60, 80 μM concentration of 6-OHDA for 24 hours, cell viability was evaluated by the MTS assay (∗∗∗p < 0.05).
