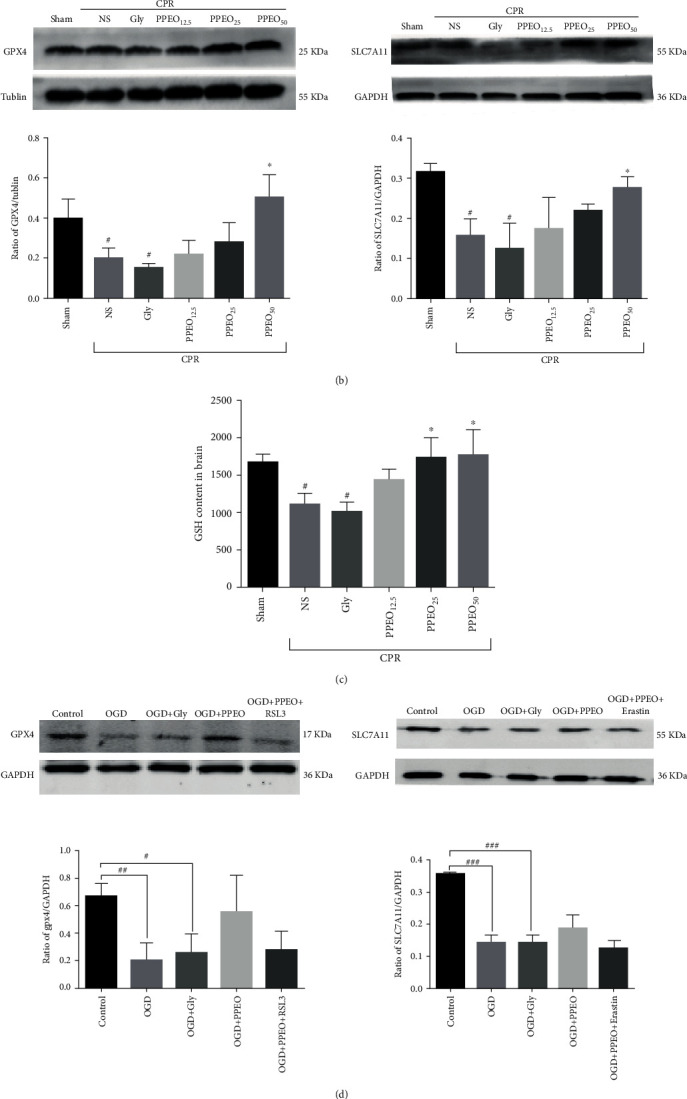
Figure 3.

(a) Immunohistochemistry staining for SLC7A11 and GPX4 in cortex neurons (400x) and statistical analysis bar graph in each group, respectively. SLC7A11 or GPX4-positive neuron was stained brown. The data were expressed as the mean ± SEM (n = 5 per group). #P < 0.05 and ##P < 0.01 compared to the sham group; ∗P < 0.05 and ∗∗P < 0.01 compared to the NS group. (b and d) Western blot analysis of GPX4 and SLC7A11 protein expression in vivo and in vitro. The data were expressed as the mean ± SEM (n = 5 per group). #P < 0.05 compared to the sham group; ∗P < 0.05 compared to the NS group. (c) Measurement of the level of GSH in different groups or SH-SY5Y cells. #P < 0.05 compared to the sham group and ∗P < 0.05 or ∗∗P<0.01 compared to the NS group. (e) GSH content assay in SH-SY5Y cells. #P < 0.05 or ##P < 0.01 compared to the control group and ∗∗P<0.01 compared to the OGD+PPEO group.
