
Figure 4.
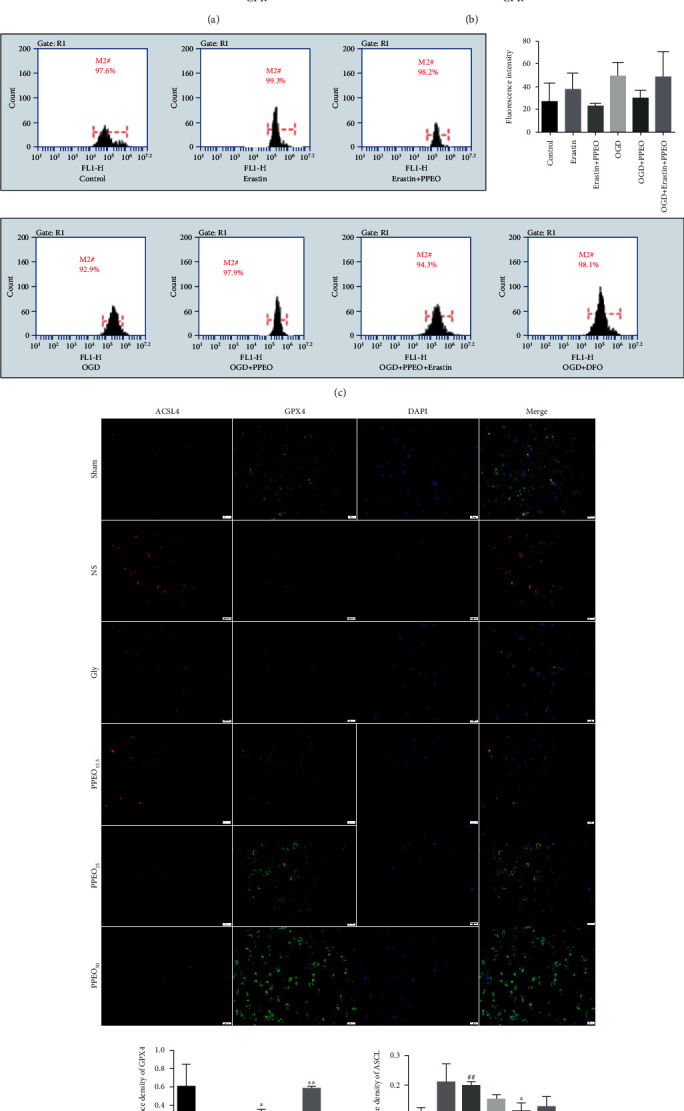
(a and b) Measurement of the level of MDA and total iron in different groups. (c) Flow cytometry assay of intracellular ROS in SH-SY5Y cells. (d) Immunofluorescence double staining of ACSL4 and Gpx4 (scale bar: 20 μm). #P < 0.05 or ##P < 0.01 compared to the sham group and ∗P < 0.05 or ∗∗P < 0.01 compared to the NS group. The data were expressed as the mean ± SEM.